The S&P 500 gained 2.33% this week with Friday's close at 7,398.93. Friday's close is a new all-time high daily and weekly close. The index has now increased six weeks in a row, our first six-week winning streak since October 2024.
The S&P 500 has gained an impressive 16.17% over its current six-week winning streak. Since 1960, this marks just the 14th time the index has gained 15% or more over a trailing six-week period.
Interestingly, the S&P 500's forward 12-week return following six-week, 15% or more advances has been decidedly favorable. The index has closed higher 12 weeks later 12 out of 13 times for average returns of 5.21%. The lone loser was a significant outlier, as that instance occurred in the depths of a nasty bear market with the S&P 500 more than -40% below its all-time high weekly close. That's polar opposite to where we are as of Friday's close, which is the highest weekly close in the history of the index. It's human nature to believe "this can't continue", but the historical precedent suggests otherwise.
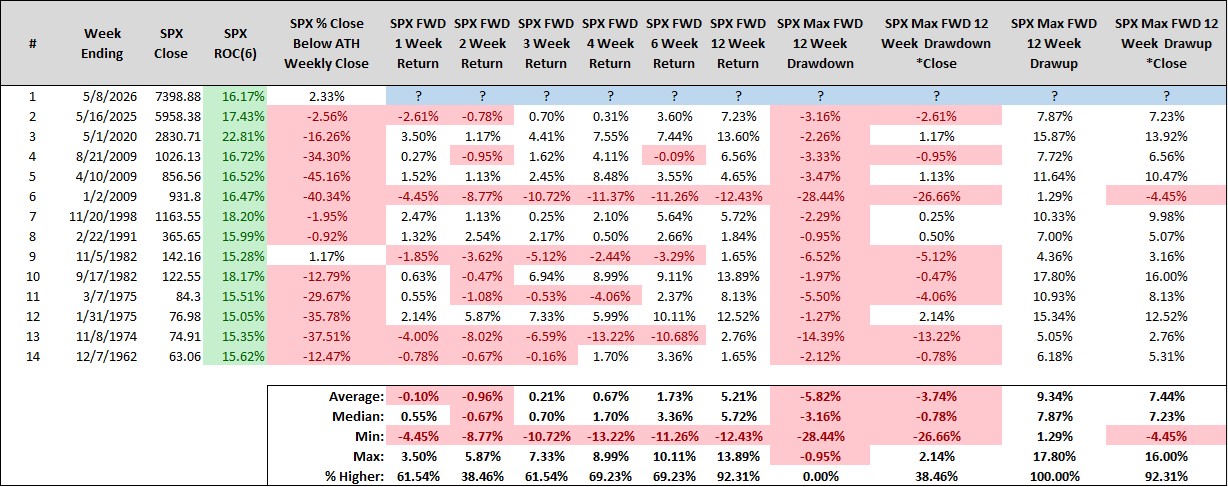
The above table yields two interesting observations. First, it's just the second time in the history of the S&P 500 where the index has gone on a six-week, 15% or more advance that also finishes at a new all-time high weekly close. The lone instance of this occurring was from 11/05/1982, making what we've just witnessed a remarkably rare sprint to new all-time highs. Say it with us now - the price of the S&P 500 trades beyond the limits of imagination!
The second observation is that we were in this exact same predicament nearly one year ago!
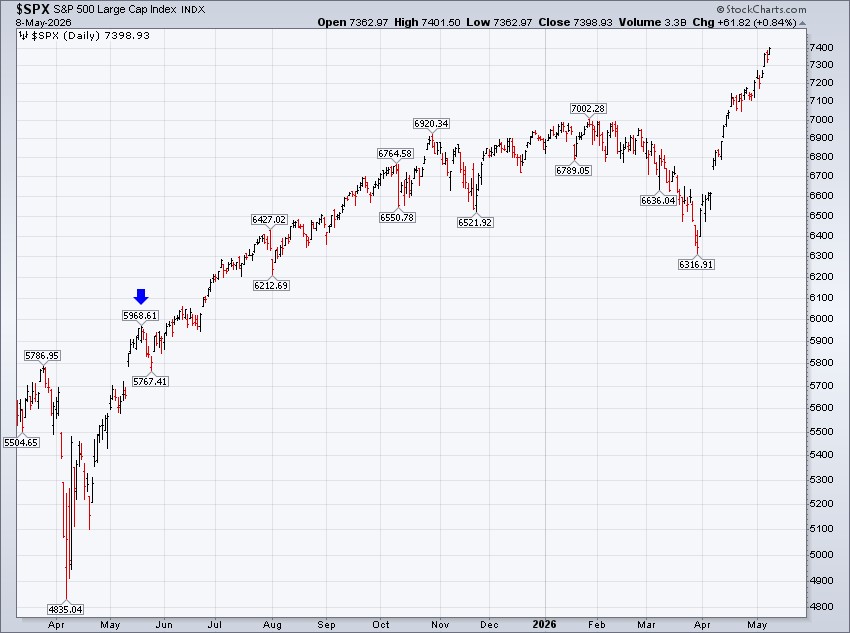
The most recent instance of this occurring was from the week ending 05/16/2025 (note the blue arrow on the chart below), when the S&P 500 gained 17.43% over a six-week stretch. Interestingly, strength into mid-May last year marked the early stages of our advance, as the S&P 500 went on to climb an additional ~1,000 points into October's high beyond the 6,900 level. Again, what happened last year has no bearing on what happens here in 2026, but that's not the point. The point is more to provide evidence that this can continue. The S&P 500 can continue to rise over time, because it is human nature to think it can't after a six-week, 16.17% sprint to new all-time highs.
Now, to many this move doesn't make sense given the broader uncertainty facing the global economy. However, it is reasonable to conclude that the Q1 reporting season has been the primary catalyst for market strength.
Per FactSet (click here), with 89% of S&P 500 companies having now reported, 84% have exceeded earnings estimates, well above both the five-year average of 78% and the 10-year average of 76%. The current beat rate is on pace to be the highest since Q2 2021. The magnitude of the surprises has been equally compelling. In aggregate, companies are reporting earnings 18.2% above estimates, well ahead of the five-year average of 7.3% and the 10-year average of 7.1%. While the "wall of worry" grew larger in March, the broader market wasn't expecting a blowout quarter on the earnings front. This "surprise" provides justification for the foundation of the S&P 500's explosive rally — the index's constituents are making money hand over fist.
Market internals have also contributed to the S&P 500's surge. Frankly, large-cap technology stocks have come roaring back and the "MAG-7" have led the way to the upside. These stocks carry the largest attribution within the S&P 500, and as they go, so goes the index — and they have been going. The S&P 500 Information Technology sector (SPT) gained 7.00% this week and has increased 30.85% over the last six weeks. The Roundhill Big Tech ETF (ticker symbol MAGS) gained 4.11% this week and has gained 25.55% over the same period. The semiconductor sector, as measured by the Philadelphia Semiconductor Index (SOX), gained 11.14% this week and is up 57.90% over the trailing six weeks. Perhaps the biggest winner of them all has been Micron (MU), which is up 109.15% over the last six weeks...and that's not a typo.
The downside here is that it has not been as strong a "stock market" as the headline index suggests.
The S&P 500 Equal Weight Index (SPXEW) is not on a six-week winning streak, and it has only gained 8.17% over the trailing six weeks. This isn't necessarily an issue in our view. When your superstars are playing lights out, your team has a great chance to win. This week serves as a good example: there was only one sector within the S&P 500 that outpaced the performance of the S&P 500 itself, SPT. Four sectors declined more than -1% this week, and five sectors gained between 0% and 0.50%. That runs counter to what you'd expect from a week where the S&P 500 gained more than 2%, but alas. Moving forward, we would obviously like to see broader participation to hedge against the idea that large-cap technology stocks hold all of the cards.
Fundamentally, Friday's jobs report provided a tailwind (click here). Nonfarm payrolls rose 115,000, significantly ahead of the consensus estimate of just 55,000. The unemployment rate held steady at 4.3%, and average hourly earnings increased 3.6% year-over-year, coming in slightly below expectations and offering some comfort on the inflation front. The report reinforced the idea that we have a labor market that is cooling gradually rather than deteriorating, preserving the soft-landing narrative that breaths a sigh of relief into forward-looking recession risks.
Some other areas of interest this week:
- The 10-year Treasury yield closed the week at 4.38%, the 2-year at 3.90% and the 30-year at 4.95%. Rates were largely unchanged on the week. Markets continue to price the Fed as essentially on hold through the remainder of the year, with roughly a ~40% probability of a rate hike being priced in by April 2027.
- Crude oil got clobbered this week, falling -7.08% with Friday's close at $94.72. Frankly, we can't wait until the words "Strait of Hormuz" go back on hiatus.
- Gold gained 2.22% this week with Friday's close at $4,714.90. Gold continues to trade rangebound and recharge its battery.
As for the week ahead, the S&P 500 enters the week riding an impressive six-week winning streak and sitting at an all-time high.
Interestingly, the trailing two-week pattern, defined as an all-time high weekly close paired with a 2% or more weekly advance, has historically been a short-term headwind. The index's forward one-week return has closed lower seven of the last eight times and 13 of the last 18 times dating back to February 1987.
Key events this week include Tuesday's release of the April Consumer Price Index (CPI), where headline CPI is expected to come in hot. A hotter-than-expected print could rattle markets, as investors have largely brushed aside inflation concerns in recent weeks. Thursday brings retail sales data, which will provide a glimpse into the health of the consumer. The path of least resistance for the S&P 500 remains higher, there are no known levels of resistance on the chart, so hopefully our six-week winning streak can make its way to seven!
S&P 500 Primary Trend - Up
Our work labels the primary trend for the S&P 500 as up, or "bullish."
With the index at all-time highs, we suspect every market observer is arriving at the same conclusion. This creates a positive feedback loop for the S&P 500 - its primary trend is up because stocks are in demand, and stocks are in demand because its primary trend is up. Momentum is real, and as Newton taught us, objects in motion stay in motion.
Long-term investors must have a process to identify when to hold 'em and when to fold 'em. Right now, the evidence suggests it's a time to hold 'em, even if your emotions want us to believe otherwise.
Psychologically, we're programmed to be risk averse when our portfolios are thriving. We become anchored to our higher account balances and want to keep every single penny we've made. This leads many long-term investors to consider de-risking their portfolio (i.e., selling stocks) for no other reason than that their returns have been stellar. We can assure you that de-risking solely on the basis of strong returns is a costly mistake more often than not.
When meaningful evidence of risk to your portfolio emerges, that's when risk should be managed. While we know the future does include the worst of times, it's clear we're still in the best of times. Until there's evidence of the worst of times truly being front and center, strive to sit tight and enjoy the ride!
