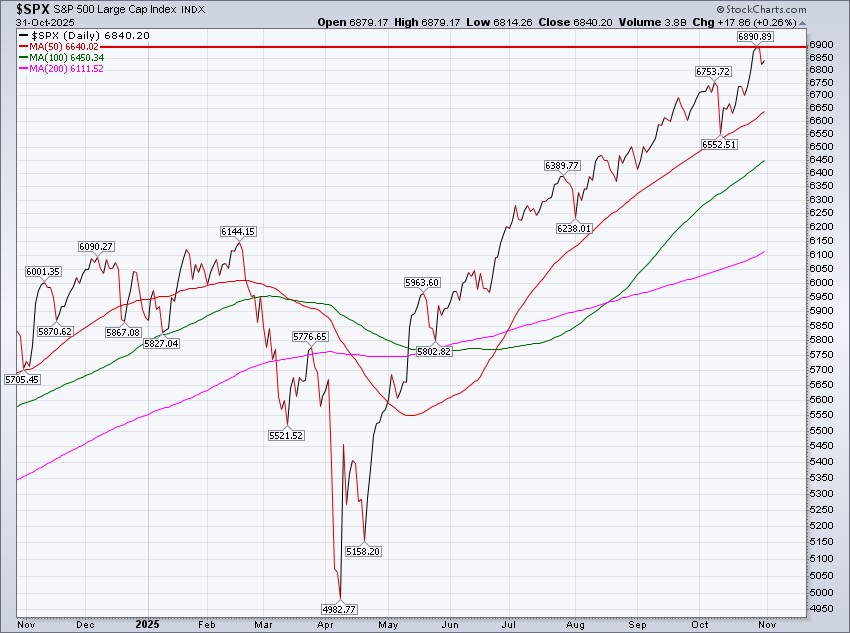
The S&P 500 gained 0.71% this week, closing Friday at 6,840.20. The index has now risen for three consecutive weeks, and Friday’s close marks a new all-time high on a weekly basis.
The S&P 500 gapped higher to start the week, climbing as high as 6,920.34 shortly after Wednesday’s open. Following the Fed’s 0.25% rate cut on Wednesday, Fed Chair Powell’s press conference (click here) threw cold water on expectations for another cut at the December meeting, and the index reversed to the downside (click here). By Friday’s close, the S&P 500 actually finished the week below its weekly open, ironic for a week that still managed to post a nearly 1% gain.
The big story this week is not that the S&P 500 gained 0.71%...it's that Nvidia, the index’s largest constituent, surged 8.71% and accounted for virtually all of the S&P 500’s weekly advance (click here). The S&P 500 Equal Weight Index (SPXEW), which includes the same stocks as the traditional market-cap-weighted S&P 500 but weights them equally, actually fell 1.75% this week. Seven sectors declined more than 1%, and three fell more than 3%. To be frank, market breadth has been poor for most of 2025, but this week it really, really stunk.
We've been writing about the S&P 500 Index almost every week for the last 17 years, but we've never seen the S&P 500 Index look like this before.
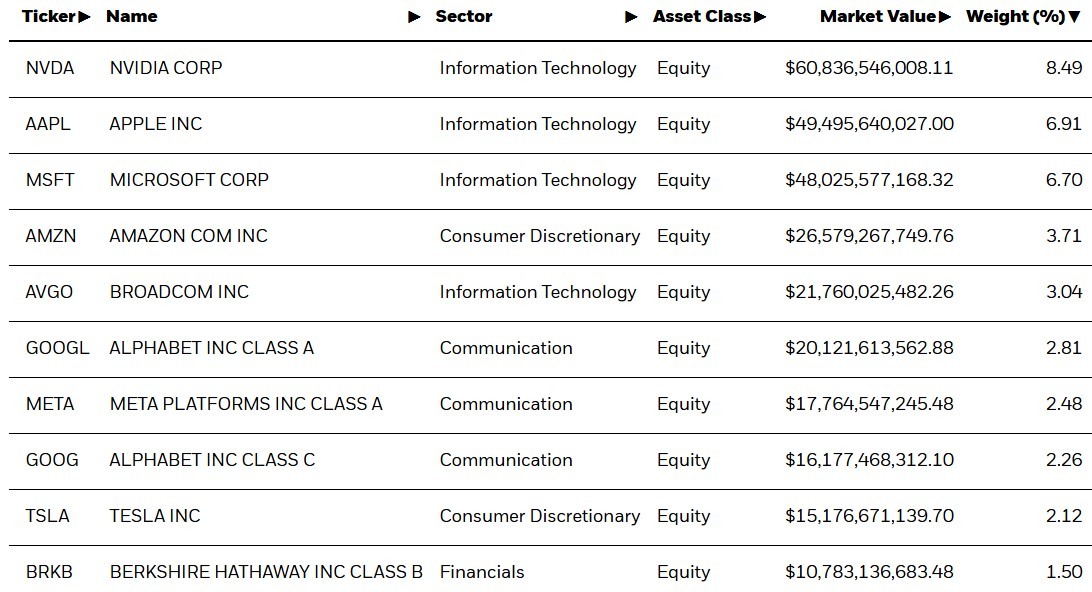
These 10 stocks account for a whopping 40.02% of the S&P 500! That’s the highest level of concentration among the index’s top 10 holdings since its inception in the 1950s.
Furthermore, the bifurcation we’re seeing, where the index’s largest holdings continue to perform remarkably well while the “broad” market mostly treads water, fuels some skepticism about the sustainability of the S&P 500’s forward-looking performance.
As an example, we ended last week’s Update questioning whether the S&P 500 would “step on the gas pedal” after breaking out to new all-time highs. One week later, we still have no clear answer. Some stocks did step on the gas (see Nvidia), but many others shifted into reverse (see SPXEW), making this week yet another reminder that beauty is in the eye of the beholder.
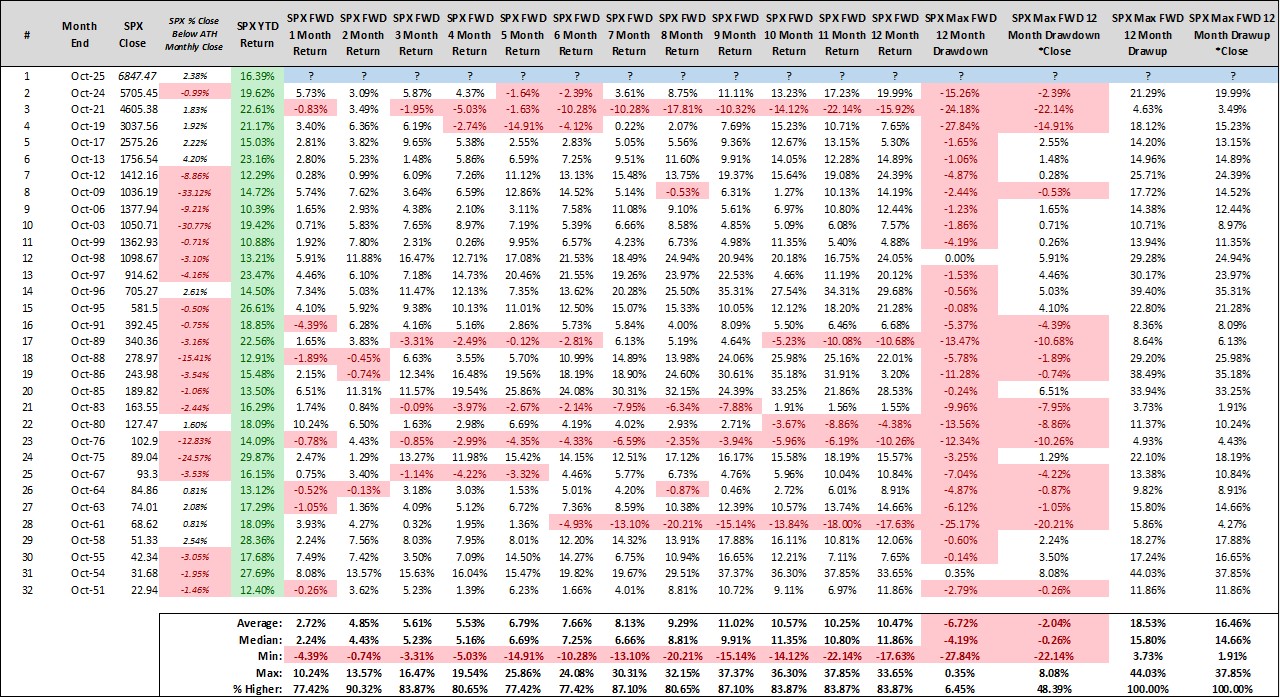
Further, calendar years like 2025 tend to finish with a nice cherry on top.
Through October’s monthly close, the S&P 500’s year-to-date (YTD) return stands at 16.30%. Looking at all calendar years that closed October with YTD returns of 10% or more, we find that the index’s cumulative return over the final two months of the year has been positive 28 out of 31 times, with average gains of nearly 5%. The three losing years didn’t even experience declines worse than 1% either.
We suppose we'll find out if "this time is different", since we know the S&P 500 is different beneath the surface...
Some other areas of note this week:
- Bond prices fell this week; the iShares U.S. Aggregate Bond Index Fund fell -0.59%. The yield on a 10-year United States Treasury bond closed Friday at 4.08%. We always chuckle a bit when interest rates across the curve move higher the same week the Fed cuts the short end of the curve.
- Gold fell -2.79% with Friday's close at $3,997.10. Gold has now declined two weeks in a row and corrected roughly -11% since its October peak at $4,381.58.
- Bitcoin is (BTC) struggling too, currently hovering around ~$110,000. BTC traded as high as ~$126,000 and as low as ~$103,000 just a few short weeks ago. Recent consolidation portends a big move.
- Big Tech earnings? Apple and Amazon crushed it, while Meta and Microsoft weren't as lucky (click here).
As for the week ahead, will the S&P 500 start November by trading back up to new all-time highs, or is the index destined to fill last week's gap and trade back down below the 6,791 level? We'll get a variety of economic reports, and there's a good bit of Fedspeak. As always, another exciting week awaits!
S&P 500 Primary Trend - Up
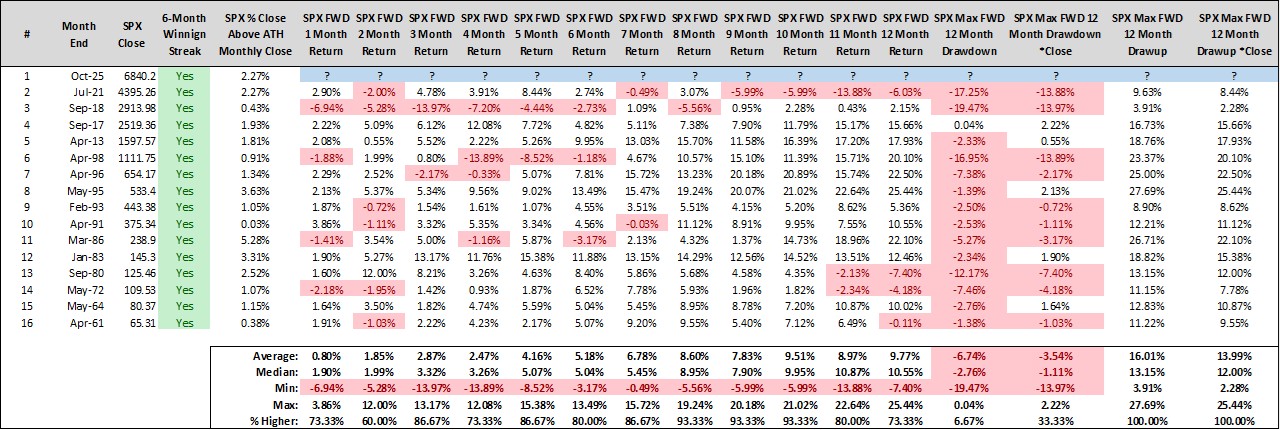
The S&P 500 finished October on Friday, gaining 2.27% and closing at a fresh all-time high monthly close. The index has now risen for six consecutive months, with each of the last five setting a new all-time high monthly close.
To say we’ve gone streaking is an understatement - the S&P 500 is on fire, like NBA Jam (click here).
After a streak like this, it’s human nature to think “this can’t continue.” After all, prices don’t move linearly forever. However, six-month winning streaks have actually been more supportive of the idea that this can continue rather than that it can’t. Will it continue? Nobody knows. But a six-month winning streak that closes at a new all-time high monthly close isn’t a harbinger of doom.
It goes without saying, but the primary trend for the S&P 500 is up, or "bullish", which means long-term investors should strive to keep it simple and straightforward, and "be right and sit tight".
It's worked for years now and if it isn't broke...don't try to fix it. Just sit back, relax and enjoy the ride...i.e., stick to your long-term investing plan with maniacal discipline.
Happy Sunday - what a World Series!
Steve & Rick