We hope you had a great holiday weekend and enjoyed your 4th of July!
The S&P 500 surged 4.02% this week with Thursday's close at 3,130.01. The index traded down to 2,999.74 on Monday and then slammed on the brakes, flipped back into drive, and slammed on the gas.
The index increased every trading day this week and easily recovered all of last week's -2.86% decline. If the narrative coming into the week was to "bend but not break", well the S&P 500 barely bent and most certainty didn't break. In last week's Update we wrote:
"Eager buying interest into lower prices is a characteristic of any and all uptrends. We'd like to see that over the next week."
In a way, that's what we saw all week long...except for Thursday, when the price action did just enough to maximize uncertainty about what lies ahead. We noted last week that the S&P 500's decline didn't break below any meaningful "support" levels. Ironically, the S&P 500's surge this week didn't break out above any meaningful "resistance" levels, with Thursday's downside reversal marking the pivot.
On Thursday, the S&P 500 traded up to its weekly high at 3,165.81, slightly above the "resistance" at the ~3,150 marker we wrote about last week. The index would ultimately set its daily high over the first half hour of trading on Thursday, and its daily low in the final half hour of trading. While Thursday saw the S&P 500 gain 0.46% from Wednesday's close, it also saw the index decline by -1.13% from the day's high and -0.43% from the day's open. The collective actions of market participants has an uncanny ability to leave us all in the dark about whether the next 100 points are higher or lower over the short term, and Thursday's reversal at "resistance", capping off an otherwise strong trading week, is the perfect example.

Now, while the lack of sustained upside during Thursday's session was disappointing, the downside reversal is still barely a budge at this point, so the index may very well break out above the ~3,150 region over the week ahead. Participants have had all weekend to digest Thursday's stellar jobs report (click here), even if it's best described as "peak PPP". They've also got more information regarding the coronavirus resurgence, which continues to be a tale of two stories.
On one hand, cases are obviously ascending, but on the other hand deaths are yet to ascend. We know increased testing plays a role in the the narrative for ascending cases, and we also know that the fans who are filling the reopening stadiums are generally those least at risk of dying from the coronavirus (i.e., the reopenings are skewed toward the under 60 and mostly healthy crowd, thus rising cases and flat deaths).
This becomes somewhat of a gift and a curse for the economy as the fatality rate of the virus for those least at risk can trend toward flu-like, which can spur consumer confidence and progression toward the "new normal" (gift), while the rise in cases will undoubtedly increase spread, increase fear, and put those most susceptible to death at greater risk of catching the virus (curse). This can force both voluntary and involuntary shutdowns, which the market is undoubtedly not pricing in as of today.
In fact, right now it feels like the market is trading as if the implications of the reignition of the coronavirus simply doesn't matter at all, which in our opinion can only be explained by the collective conviction in further fiscal and monetary policy actions in the event things do once again "shut down" economically.
So as long as there's a sturdy bridge, or a gigantic monetary backstop that "bridges" both businesses and consumers to the other side of a world free from fear of the coronavirus, the future for the economy and corporate profitability can only be better than the present. Collectively, we don't believe governments and central banks around the world will take a "half measure" (click here).
As we look to next week, downside momentum to open the week will perpetuate the idea of our trading range. Price is doing a whole lot of nothing, oscillating wildly between ~3,000-3,150. However, a trade above 3,165.81 might finally see the index get past the ghost at ~3,150. We're rooting for you, Scoob!
S&P 500 Primary Trend - Neutral
The S&P 500 finished the month of June on Tuesday at 3,100.29. The upside reversal on Monday and Tuesday left the index gaining 1.83% for June, which leaves the narrative as price consolidation following an incredible April and May.
The monthly chart of the S&P 500 remains confined between our all-time high monthly close at 3,230.78 and 2,584.59. The range is wide at 25%, but one can argue nothing good is happening for the S&P 500 with monthly closes between these two levels (i.e., the index is trendless).

We continue to label the primary trend for the S&P 500 as "neutral" and believe an "uptrend" or "downtrend" can only solidify itself by a monthly close above or below the range. Long-term investors are always best served investing in asset classes whose primary trend is labeled as up, or "bullish". At the moment, there are clear uptrends in both gold and fixed income, both on an absolute and relative basis. Therefore, we continue to believe long-term investors are best served with a "diversified" asset allocation at the moment.
"Diversification" is about positioning portions of your portfolio to perform in a wide variety of unknown macroeconomic backdrops into the future.
We also believe the S&P 500's trendless environment is the result of a very wide range of future macroeconomic backdrops, or put more simply, a very uncertain future for both the economy and corporate profitability. Therefore, our rules suggest it's no time to play "hero" with your asset allocation - it's time to choose the risks you accept wisely.
Importantly, we come to this conclusion based on what's known and knowable, rather than speculating about what lies ahead. However, we are huge fans of quantifying what's known and knowable in the present (i.e., current price action) in order to establish an objective precedent. While precedent is never consistently predictive, the behavior of market participants in the present always reveals information about their expectations into the future (it's only debatable how much information is truly revealed). If history is any guide, what we've just witnessed the last three months will mark the next primary trend for the S&P 500 as up, or "bullish".
The index just gained 19.95% over the last three calendar months, meaning there's been tremendous buying interest for stocks the last three months.
Broadly speaking, this should only occur when market participants, collectively, all believe in the story of higher prices into the future. While there are a myriad of reasons a participant chooses to sell stocks, there's only one reason a participant chooses to buy stocks (they believe it will be an equitable investment into the future).
Looking at all instances where the S&P 500 gained 15% or more over a 3-month period reveals that strength in the present precedes strength into the future, at least historically. There are 14 prior 3-month periods where the S&P 500 gained 15% or more (excluding overlapping samples), and the S&P 500's performance over the forward one year has been beyond impressive. After gaining 15% or more over 3 months, the index closed higher 4 months later 100% of the time, 14 of 14 instances, for average returns of 8.21% on a monthly closing basis. That's the equivalent of the S&P 500 closing the month of October 2020 at 3,354.

Putting it all together, the bulls regained control of the ball these last three months and they're racking up the points. It feels like it can't continue, but that's generally a sign that it can, and will, continue. While the primary trend in the present is "neutral", the most likely primary trend into the future is up or "bullish". It's imperative long-term investors don't let the fear of striking out keep them from playing the game.
S&P 500 Technology Sector Bends & Booms
We wrote last week how the S&P 500 Information Technology Sector (SPT) looked a bit "worrisome" as it was running into "resistance" at its prior all-time high. This was fueling the possibilities of a "double top". We wrote that it was imperative that SPT find its footing this week, so we're happy to report that SPT did just that. Lebron James rarely plays two bad games back-to-back, and SPT rarely has two bad weeks back-to-back.
SPT gained 3.68% this week with Friday's close at 1,851.33. Friday's close is a new all-time high weekly close for SPT.
SPT also recorded a "bullish outside reversal week" (BORW), which is defined as a calendar week with a lower low, higher high, and higher close than the prior trading week. SPT began the week trading down to 1,765.23, a bit below its 20-day simple moving average, and then proceeded to skyrocket the remainder of the week.
SPT consolidated at "resistance", trading at and around ~1,800 for three consecutive weeks, as if to make sure the coast was truly clear. SPT decided this week the coast was indeed clear.
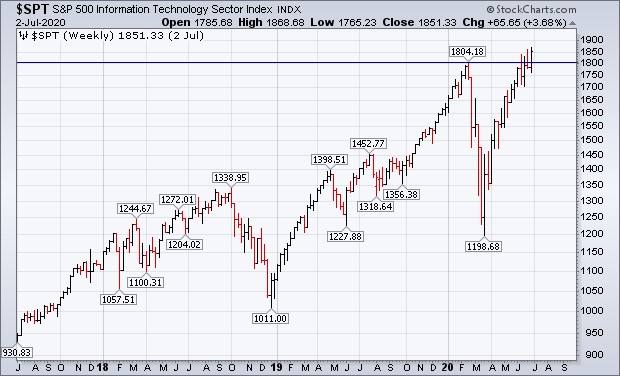
Historically, BORWs paired with all-time high closes for SPT have marked further upside momentum over the coming one month. There are 11 prior BORWs that closed at an all-time high for SPT since 1997, and 9 of the 11 saw the index close higher 1, 2, 3, and 4 weeks later. The forward 1 and 2 weeks have closed higher each of the last 9 times this setup has occurred.

While this is a crime of small numbers, and something that's occurred this rarely is noise and not signal, it is a good omen for the Lebron James of the market finding its shot. SPT accounts for roughly 27% of the S&P 500's return, so its safe to say that as goes SPT, so goes SPX.
SPT's two largest holdings are Microsoft (MSFT) and Apple (AAPL). Within the S&P 500, MSFT is the single largest holding at roughly 6.03% with AAPL just a tad behind at 5.72% of the index. That's right...more than 10% of the S&P 500 is held in just these two stocks. Here are their charts:

What do the charts of MSFT and AAPL have in common? They're both in primary uptrends.
These stocks are carrying the market on their backs, and at the moment that's a good thing. It won't last forever, nothing does, but neither MSFT nor AAPL are showing any signs of slowing down. Again, that's a good thing.
Gold Is Knocking On The Door
Gold closed the month of June at $1,800.50, its second highest nominal close in the history of the metal. Gold has now increased four months in a row and is higher by nearly 25% over the trailing one year.
The primary trend for gold is up, or "bullish", and it continues to be a great portfolio "diversifier" given global central banks behaving as if their one true mandate is "inflate or die".

As we look to the month of July, gold is in position to break out on the monthly chart. The all-time high monthly close for gold is $1,826.90. Gold closed roughly ~$36 below it on Friday. We do believe the $1,800 level will show "resistance", especially since four-month winning streaks for gold have a very difficult time making it to a five-month winning streak. Each of the last 5 four-month winning streaks for gold saw the metal decline in month five, and eight of the last nine failed to make it five straight to the upside overall since 2002.
In other words, it won't be surprising if gold takes a breather here in July. That said, it will be a meaningful sign of strength in the event the metal can buck its historical tendency and move higher for the fifth consecutive month. Forward-looking inflation expectations are ascending, and while gold has been a terrible hedge against inflation over the long term, it's been the single best hedge against inflation while inflation itself is actually ascending. A pivotal month for gold awaits.
Happy Sunday!
Steve & RickThis material is being provided for client and prospective client informational purposes only. This commentary represents the current market views of the author, and Nerad + Deppe Wealth Management (NDWM, LLC) in general, and there is no guarantee that any forecasts made will come to pass. Due to various risks and uncertainties, actual events, results or performance may differ materially from those reflected or contemplated in any forward-looking statements. Neither the information nor the opinions expressed herein constitutes an offer or solicitation to buy or sell any specific security, or to make any investment decisions. The opinions are based on market conditions as of the date of publication and are subject to change. All data is sourced to stooq.com and stockcharts.com. No obligation is undertaken to update any information, data or material contained herein. Past performance is not indicative of future results. Any specific security or strategy is subject to a unique due diligence process, and not all diligence is executed in the same manner. All investments are subject to a degree of risk, and alternative investments and strategies are subject to a set of unique risks. No level of due diligence mitigates all risk, and does not eliminate market risk, failure, default, or fraud. It should not be assumed that any of the securities transactions or holdings discussed were or will prove to be profitable, or that the investment recommendations or decisions we make in the future will be profitable, or will equal the investment performance of the securities discussed herein. The commentary may utilize index returns, and you cannot invest directly into an index without incurring fees and expenses of investment in a security or other instrument. In addition, performance does not account other factors that would impact actual trading, including but not limited to account fees, custody, and advisory or management fees, as applicable. All of these fees and expenses would reduce the rate of return on investment. The content may include links to third party sites that are not affiliated with NDWM, LLC. While we believe the materials to be reliable, we have not independently verified the accuracy of the contents of the website, and therefore can't attest to the accuracy of any data, statements, or opinions.
