The S&P 500 gained 1.55% this week with Friday's close at 4,500.53. The index has now increased two weeks in a row after falling each of the prior three weeks to start 2022.
The S&P 500 came out of the gates strong this week for a change, rising by 1.88% on Monday alone. This week's upside reversal was pretty textbook in our opinion, and we don't get to type this all that often. In last week's Update we wrote:
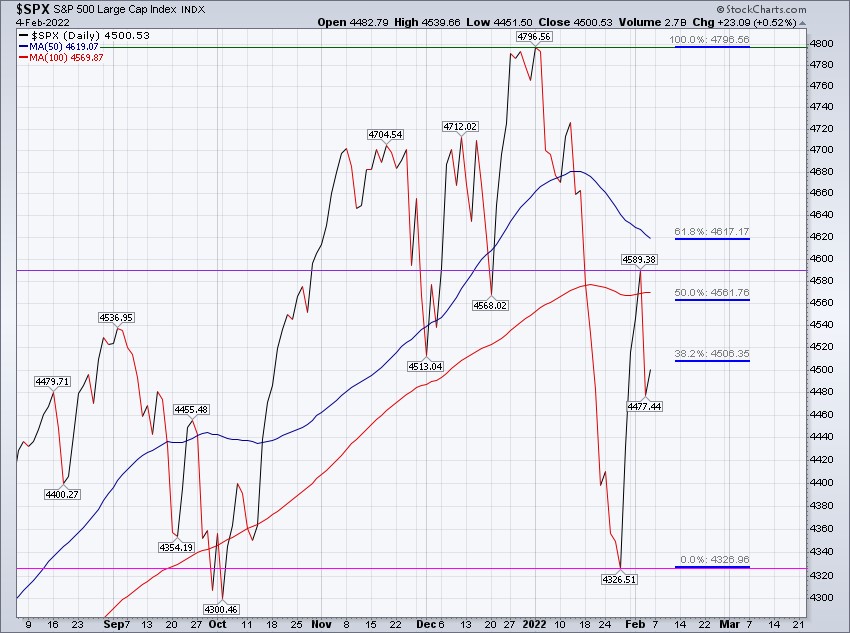
"Given the steepness of this selloff, combined with extremely negative sentiment (click here) and rather drastic "oversold" conditions, we do believe there should be a material retracement higher in the deck of cards over the short term, ideally over the week ahead. Fibonacci retracement analysis would suggest the S&P 500 extends into the ~4,520-4,590 region, which would bring about a retest of our 50- and 100-day simple moving averages (50MA, 100MA), which presently sit at 4,635.78 and 4,567.36 and are descending."
This is exactly what we saw this week with the S&P 500 trading up to 4,595.31 on Wednesday. However, that's where we ultimately failed our retest!
Given Facebook/Meta's earnings catastrophe after the bell on Wednesday (click here), the S&P 500 declined -2.44% on Thursday, trading all the way back down to 4,470.39. Friday then saw the index trade down to 4,451.50 and it appeared the S&P 500 was going to give back all of its weekly gains, but we saw a decent rally over most of Friday's session to leave the week finishing in positive territory.
The big economic news on Friday was the massive beat in the jobs report (click here), but it's difficult to know just how participants, collectively, will discount better than expected economic data. A bevy of better than expected economic data could embolden the Federal Reserve to strongly consider raising interest rates by 0.50% in March, something that the federal funds futures market currently prices with just a ~15% probability.
Alternatively, economic data that's coming in equal to or worse than consensus expectations will undoubtedly keep March's federal funds rate hike at 0.25%. With the markets currently expecting a 0.25% rate hike, continued better than expected economic data is a case of "be careful what you wish for".
In terms of price action, there is still an overwhelming element of fragility and uncertainty. Taking Friday as an example, the S&P 500 went from ~4,525 to ~4,500 in the final 15 minutes of trading. Taking this week as an example, at the high of the week the S&P 500 was higher by 3.69%, but by the close of the week the index was higher by a mere 1.55%. Naturally, it's a case of the glass being both half full and half empty.
On the hall full side, the index rose for the second consecutive week, gained more than 1% on the week, and remains comfortably above both January's intraday low (4,222.62) and closing low (4,326.51). On the half empty side, the index closed this week -2.06% below its weekly high, so higher prices did bring an element of selling pressure into the marketplace. The retest failed.
Importantly, whether the glass is truly half full or half empty will probably depend on next week's price action.
There's another retest on deck, just don't ask us whether we're retesting this week's high in the ~4,590s, or retesting January's low in the 4,200-4,300 range.
This week's downside reversal marked "resistance" at and around the 50-day simple moving average (50MA, solid red line). This is also a textbook case of old support, once broken, becoming new resistance. This is somewhat of an ominous sign, and us bulls would like to see the S&P 500 reclaim its 50MA and quickly.
In terms of sectors, it was the energy show once again this week with the sector gaining another 4.98%. The S&P 500 energy sector is now higher by an astounding 24.30% thus far in 2022. The financial sector outperformed again this week too, rising by 3.56%. Consumer discretionary finally got a lift too this week, rising by 3.54%, undoubtedly fueled by Amazon's gigantic move higher following earnings on Friday (click here).
Outside of these three sectors, every other sector underperformed the S&P 500 as a whole this week. The rally wasn't overly broad, so a true price thrust higher remains elusive.
For the week ahead, this week's high was 4,595.31 and the low was 4,414.02, so we'll be watching to see if the S&P 500 trades "outside" of these levels.
Fundamentally, all eyes will be glued to Thursday's inflation data. It's clear inflation is the 800-pound gorilla in the room, and there's virtually no visibility into how the inflationary conundrum will unfold here in 2022. Furthermore, there's even no visibility into whether or not increases to the Federal Reserve funds rate will even have an affect on inflation!
S&P 500 Primary Trend - Neutral
The S&P 500 finished the month of January on Monday at 4,515.55, recording a monthly decline of -5.26%. Based on our work, January's decline was enough to change the primary trend from up, or "bullish", to neutral.
Long-term investors remain best served with an equity overweight across their asset allocation and relying mostly on passive investing methodologies. However, they also remain best served stepping on the brakes just a little bit, i.e., the degree of equity overweight they carried into February should be lower than what they carried into January, at least in our opinion. The primary trend shifting from up to neutral is analogous to having some traffic on the road...you've got to step on the brakes, slow down, and turn the autopilot (cruise control) off.

The price action in the month of January was totally wild. January became just the second calendar month in the history of the S&P 500 to record both a new all-time high and a -10% drawdown from the prior month's close (the other is February of 2020).
Another way to quantify what we saw in January is to identify all calendar months that have both a new all-time high and then finish with a monthly decline of -4% or more. This will pluck all calendar months that saw a degree of eager selling pressure into new all-time high prices for the S&P 500, a narrative that reads like distribution.

We'd be remiss in not pointing out that the only other Januarys on the table above are from the years 2000 and 1990.
In terms of price action, there are many similarities back to the year 2000, such as tech underperformance and energy outperformance, and our base case for 2022's price action is for a volatile year that ultimately is range- bound, similar to that of 2000 and 1990. The "easy" money has been made, unfortunately.
If 2022 does echo the years 2000 and 1990, we should have mostly smooth sailing in front of us the coming six months and then a challenging end to the year. Given federal funds futures probabilities, that would invoke the old phrase "3 steps and a stumble" (click here).
Interest Rates Break Out, Huge Implications
Perhaps the most influential move this week came in the yield curve. The yield on a 10-year United States Treasury bond (UST10y) surged 15 basis points, or 8.43%, with Friday's close at 1.93%.
UST10y has now hurdled "resistance" via its 200-week simple moving average and 2021's closing weekly high. There's nothing but air left on the charts into the ~2.4% level. All things considered, economically speaking, it's totally egregious that UST10y is still only 1.93%, so it would not be surprising to see UST10y start to step on it to the upside.

Crestmont Research has a piece titled the 6/50 rule (click here) where they effectively show that it's all but guaranteed that interest rates will change by 50 basis points, or 0.50%, each and every rolling six-month period.
While the 6/50 rule doesn't have any directional bias (it simply implies interest rates will move up or down by 50 basis points every six months), applying the rule to the breakout we're witnessing across UST10y paints a fairly scary picture. One has to question whether UST10y will be trading at 2.43% on or before August of 2022...and then one has to wonder if UST10y is trading at 2.93% on or before the end of 2022!
Given recent correlations, we're not exactly going out on a limb by believing that if UST10y zooms to 2.43% level the technology sector is going to struggle. With technology accounting for nearly 30% of the S&P 500, this will create a headwind for the S&P 500 and its ability to trend higher. The old phrase "it's a stock picker's market" has perhaps never been more applicable, especially when considering sector dispersion.
Higher interest rates also serve to inch us closer to the end of "TINA" (an acronym for "there is no alternative") and serve as a brake on economic activity, and thus negatively affect corporate profitability.
We've always been of the opinion that the Fed would not lose control of the curve, implying that any financial market instability caused in part by higher interest rates would lead the Fed toward yield curve control (click here). However, given the Fed's hard-line policy stance toward inflation, which has seen them throw away such words as "transitory" and turn incredibly hawkish in tone, yield curve control would seem to be virtually impossible for them to implement here in 2022.
We're in a tightening cycle where the Fed is ending quantitative easing and exploring ways to reduce their balance sheet, and that's exact opposite of a cycle where they're effectively using their balance sheet to control the curve. Fed jawboning could, in theory, help them control the curve as even the mention of yield curve control could be enough to stem the bond vigilantes, but we can't help but wonder if the bond market would call the Fed's bluff.
If inflation is the 800-pound gorilla in the room, then it's inflation's impact on the yield curve that forces the gorilla to start to smash like King Kong.
Part of the reason the gorilla hasn't started to smash is that UST10y is still only 1.93%, in spite of inflation annualizing at more than 7% year-over-year. Should that change, should UST10y play catch-up and the bond vigilantes actually make an appearance, the gorilla will probably let its presence be known.

Happy Sunday!
Steve & RickThis material is being provided for client and prospective client informational purposes only. This commentary represents the current market views of the author, and Nerad + Deppe Wealth Management (NDWM, LLC) in general, and there is no guarantee that any forecasts made will come to pass. Due to various risks and uncertainties, actual events, results or performance may differ materially from those reflected or contemplated in any forward-looking statements. Neither the information nor the opinions expressed herein constitutes an offer or solicitation to buy or sell any specific security, or to make any investment decisions. The opinions are based on market conditions as of the date of publication and are subject to change. All data is sourced to stooq.com and stockcharts.com. No obligation is undertaken to update any information, data or material contained herein. Past performance is not indicative of future results. Any specific security or strategy is subject to a unique due diligence process, and not all diligence is executed in the same manner. All investments are subject to a degree of risk, and alternative investments and strategies are subject to a set of unique risks. No level of due diligence mitigates all risk, and does not eliminate market risk, failure, default, or fraud. It should not be assumed that any of the securities transactions or holdings discussed were or will prove to be profitable, or that the investment recommendations or decisions we make in the future will be profitable, or will equal the investment performance of the securities discussed herein. The commentary may utilize index returns, and you cannot invest directly into an index without incurring fees and expenses of investment in a security or other instrument. In addition, performance does not account other factors that would impact actual trading, including but not limited to account fees, custody, and advisory or management fees, as applicable. All of these fees and expenses would reduce the rate of return on investment. The content may include links to third party sites that are not affiliated with NDWM, LLC. While we believe the materials to be reliable, we have not independently verified the accuracy of the contents of the website, and therefore can't attest to the accuracy of any data, statements, or opinions.
