The S&P 500 declined -0.28% this week with Friday's close at 3,215.63.
The index traded as high as 3,279.99 on Thursday, only to then reverse lower by -1.96% into Friday's close. The ~3,270 price region revealed itself as "resistance" all week long. Tuesday's high was 3,277.29, Wednesday's high was 3,279.32, and Thursday's high was 3,279.99, yet we finished the week below Monday's open and almost exactly on our weekly low at 3,215.16. If the bulls had 1st-and-goal from the 1, the bears at least stuffed the run on 1st down.
Importantly, it's now just 2nd-and-goal from the 1-yard line. It's not as if the bears got a sack, forced a fumble, or the bulls lost 5 yards on a false start this week. While there was a -1.96% decline from Thursday's high, we're only talking about a weekly decline of -0.28%. Things will get a lot more interesting in the event the bears get another stop on 2nd down, analogous to the S&P 500 trading down and closing lower over the week ahead. However, the S&P 500 at least remains in position to score as we enter the final week of July.

This week's decline was mostly attributable to the technology sector again finding selling pressure. The Nasdaq Composite (COMPQ) traded up to a new all-time high at 10,839.93 on Tuesday, only to then fall -4.39% into Friday's close at 10,363.18, finishing with a weekly decline of -1.33%. COMPQ nearly recorded its second consecutive "bearish outside reversal week", something we've never seen before in the history of the index.
We wrote last week that we believed COMPQ's weakness would be temporary, and that the technology sector would find its footing over the weeks ahead. That certainly didn't unfold this past week, however COMPQ managed to end the week right on plausible "support" via its 20-day simple moving average (20MA).
The 20MA has marked the end of pullbacks for COMPQ since March (yellow highlights below). While the 20MA contains no predictive qualities regarding the price of COMPQ, it is an objective price level that's the same for all market participants, thus it's plausible we see participants act accordingly (eager buyers buy, eager sellers cover i.e. buy, and prices reverse to the north).
We'll hear from Apple (AAPL), Alphabet/Google (GOOGL), Facebook (FB) and Amazon (AMZN) this week, so there are plenty of "technology" catalysts over the week ahead (although AMZN and FB aren't in the technology sector). Naturally, we think the S&P 500 will go as COMPQ goes this week.

In addition to big tech/market cap earnings, we also have the Federal Reserve meeting, announcement, and press conference this week. That always has the ability to be market moving. Chairman Powell will be sure to choose his words wisely, something he's seemingly mastered since his gaffe in December of 2018. We'll also hear more about the impending stimulus package that's headed our way as our fearless leaders continue to jostle about another round of stimulus checks, the ideal amount of unemployment benefits, and how to enhance/reload the PPP.
Interestingly, what better way to gain the support of the public for further policy actions than to announce the deal after the Q2 GDP number released on Thursday! (Speculatively speaking, we're watching for a deal to be announced Friday morning). Fiscal and monetary policy have both been all in with a "whatever it takes" approach to combating the economic implications of the coronavirus, and we expect to hear more of the same over the week ahead.
S&P 500 Primary Trend - Neutral, or Back In Drive?
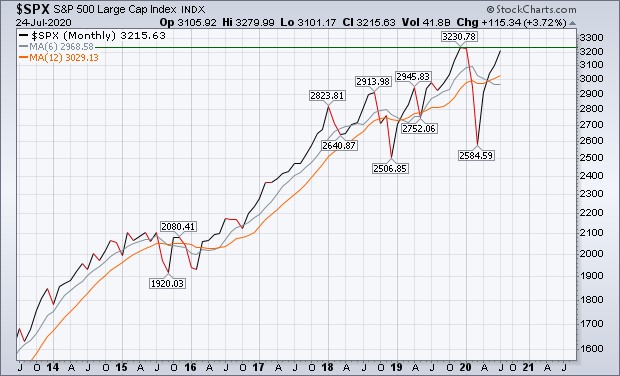
The S&P 500 is presently higher by 3.72% for the month of July. The week ahead will be the final five trading days of the month, and the index is in position to record a four- month winning streak, and close at a fresh all-time high monthly close. Our current all-time high monthly close is 3,230.78. A close just slightly above that wouldn't operate as an all-clear sign, but a close above ~3,330 would definitely signify a quantifiable "breakout", at least according to the 3% rule.
Until such time, the index remains in "neutral" with a meaningful tilt toward drive. The the car is rolling, it appears the traffic is clearing, but we'll need to see evidence that we've actually slammed on the gas Conversely, a monthly close below 3,200 would mark a second consecutive calendar month to trade beyond the 3,230.78 level, but ultimately fail in closing the month at a fresh all-time high. That would be interpreted through the lenses of "distribution", and a sign that while the car is rolling, the traffic might not actually be clearing.
As we've often discussed, asset allocation decisions are not only a function of your individual investor attributes, but also a function of an asset class's absolute performance and its relative attractiveness compared to other asset classes.
Given the wide range of future outcomes for both the global economy and all asset classes in the traditional investable universe, we've been preaching "diversification" for months.
Importantly, we're generally not advocates of diversifying for the sake of diversifying, which is the standard, robotic-like approach of most financial advisors and/or investment managers. Instead, we believe in concentration, especially when there are only a few asset classes in discernible uptrends. In our view, there are times to be diversified by investing in a variety of asset classes, and times to invest with a concentrated asset allocation, investing in only a few asset classes (perhaps only one). But as we head into August of 2020, it's undoubtedly a time to be diversified. Here's why:
Fixed Income's Primary Trend Is Up

If we measure TLT against the S&P 500, as measured by the iShares S&P 500 Index fund (ticker symbol IVV,) we can note that TLT is also showing relative strength when compared to stocks. TLT has outpaced IVV by 18.31% the last 12 months.

If the impetus behind diversification is to position portions of your portfolio to perform in a variety of unknown future macroeconomic climates, TLT's role is to operate as a safe haven in the event the future for the economy and corporate profitability is far worse than market participants in stocks are pricing in at the moment.
TLT is probably your portfolio's best friend in the event "we're doomed". This works to provide a compliment to stocks, which undoubtedly thrive in the event that "we're not doomed".
Gold is the Same Story
Gold's primary trend is up too, and it's absolutely trounced all other asset classes in the traditional investable universe. Gold, as measured by the SPDR's Gold Shares Index fund (ticker symbol GLD), is on the verge of closing July at a fresh all-time high too. GLD has climbed from a monthly close at $112.76 in early 2018, to a potential monthly close near $180 here in July. The metal came into this month on a four- month winning streak, something that's often been a sign that the metal needs a break, and yet GLD is higher by 6.77% thus far in July - a major sign of strength.

If we measure GLD against the S&P 500, again by the iShares S&P 500 Index fund (ticker symbol IVV), we can note that GLD is also showing relative strength when compared to stocks. GLD has outpaced IVV by 21.93% the last 12 months. There's your "alpha", assuming a liberal definition of the word.

So, given where we are in the world (filled with chaos, uncertainty, and cardboard cutouts watching major league baseball games), a portfolio that's prudently diversified would seem to include stocks, bonds, and gold for the majority of investors. We don't think that's going to change any time soon, unfortunately.
Speaking of Gold (and Silver) - All Time High Weekly Close for Gold, Silver Explodes
Gold, as measured by the price of the actual metal, gained 4.83% this week with Friday's close at $1,897.50. Friday's close is a new all-time high weekly close, eclipsing 2011's all-time high at $1,886.40.
Gold has now increased 7 weeks in a row and blatantly defied its historical bias for weakness following 6-week winning streaks as we discussed last week. The great Wayne Whaley always preaches that when an asset trades in opposition to a strong historical bias, go with the market. That would appear to be the case thus far for gold.

So we're on to a 7-week winning streak for gold. Like 6-week winning streaks, gold's forward performance following 7-week winning streaks is mostly red, meaning gold closes lower four weeks later, but the instances from the 1970s are mostly an exception. Gold is remarkably "overbought" on its daily chart, and its trailing 14-day Relative Strength Index (RSI) closed Friday at 80.91, so a pullback would be totally normal.
However, we'll view any pullback for gold as normal, healthy, and temporary given the context of what's transpiring. Weakness in the short term will only interrupt gold's primary uptrend, it won't end it...especially since we expect to hear the Federal Reserve say "we're going to inflate or die" this week. Not exactly in those words, but that's the most probable takeaway from whatever Powell says.
Silver Explodes
Silver gained a whopping 15.61% this week with Friday's close at $22.85. This is silver's highest weekly close since 2012. Silver has pivoted lower from the ~$18-$18.50 price level for years, since late 2017. This time was different.

Silver is known to be gold's crazy little brother, meaning when the going gets good in the metals space it's silver where things get really, really, really good. But this goes both directions, and speculation to this degree in silver is a bit worrisome, at least for the short term. Like gold, we consider silver's breakout to be a positive over the intermediate and longer term, but in the short term a 15%+ advance in five trading sessions, putting the stamp on a 7-week winning streak, is a bit excessive.
We'd like to see gold and silver take a break, recharge their batteries, and then continue to travel to the north. A further advance from here would seem to only exacerbate "overbought" conditions that precede sharp, fast, violent corrections.
As always, another exciting week awaits.
Happy Sunday!
This material is being provided for client and prospective client informational purposes only. This commentary represents the current market views of the author, and Nerad + Deppe Wealth Management (NDWM, LLC) in general, and there is no guarantee that any forecasts made will come to pass. Due to various risks and uncertainties, actual events, results or performance may differ materially from those reflected or contemplated in any forward-looking statements. Neither the information nor the opinions expressed herein constitutes an offer or solicitation to buy or sell any specific security, or to make any investment decisions. The opinions are based on market conditions as of the date of publication and are subject to change. All data is sourced to stooq.com and stockcharts.com. No obligation is undertaken to update any information, data or material contained herein. Past performance is not indicative of future results. Any specific security or strategy is subject to a unique due diligence process, and not all diligence is executed in the same manner. All investments are subject to a degree of risk, and alternative investments and strategies are subject to a set of unique risks. No level of due diligence mitigates all risk, and does not eliminate market risk, failure, default, or fraud. It should not be assumed that any of the securities transactions or holdings discussed were or will prove to be profitable, or that the investment recommendations or decisions we make in the future will be profitable, or will equal the investment performance of the securities discussed herein. The commentary may utilize index returns, and you cannot invest directly into an index without incurring fees and expenses of investment in a security or other instrument. In addition, performance does not account other factors that would impact actual trading, including but not limited to account fees, custody, and advisory or management fees, as applicable. All of these fees and expenses would reduce the rate of return on investment. The content may include links to third party sites that are not affiliated with NDWM, LLC. While we believe the materials to be reliable, we have not independently verified the accuracy of the contents of the website, and therefore can't attest to the accuracy of any data, statements, or opinions.
