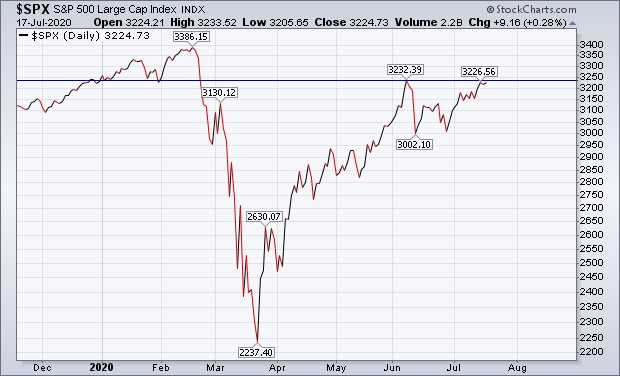
The S&P 500 gained 1.25% this week with Friday's close at 3,224.73. The index has now increased three weeks in a row for just the second time in 2020.
In last week's Update we wrote that we believed the S&P 500 would "retest the ~3,233.13 level sooner rather than later". The index ultimately traded up to 3,235.32 on Monday, only to then completely fail its first "retest". The S&P 500 closed Monday at 3,155.22, a decline of -2.48% from Monday's high. After Monday's close, it felt like resistance from June's high had persisted, but the remainder of the week had other ideas.
The S&P 500 would trade down to 3,127.66 shortly after Tuesday's open and that's where we saw the same thing we've seen each and every week the last month - eager buying interest into lower prices.
The index would gain more than 100 points from Tuesday's low into Wednesday's high at 3,238.28, with Wednesday's high recording as the high of the week. The index remains in position to "break out" to the upside. It's first and goal from the 1, and while goal line stands are possible, they're never the most probable outcome. A touchdown should then see the S&P 500 retest its all-time highs at 3,386.15.
The price action this week was totally rotational. We wrote last week that we didn't think it was too much to ask for the S&P 500 Equal Weight Index (SPXEW) to get its act together, and the market gods clearly read our Update. SPXEW finally joined the SPX party.
SPXEW gained 3.71% this week, more than three times that of the S&P 500. The industrial, material, utility, and energy sectors have been major laggards the last month-plus, and they were major leaders this week with all of them gaining 3% or more. Meanwhile, the S&P 500 Technology Sector, the Lebron James of the market, declined -1.16% this week. If this week was a Lakers basketball game, it was a Lakers win with everyone but Lebron James carrying the load, the epitome of team basketball. This is encouraging as it shows that the market has the buying interest to not just be a "one-trick pony". When the star has an off night (Amazon declined -7.44% this past week), the rest of the team can pick up the slack.
SPXEW, relative to SPX, bottomed in the same vicinity as all prior bottoms thus far in 2020 (yellow highlighted region). Follow-through to the upside over the week ahead would certainly be ideal.

But, what about the technology sector...will it find its shot? Well, analyzing the sector by studying the price action in the Nasdaq Composite (COMPQ) reveals there's a great chance that this week was just an off week, a small bump in the road, and not something that suggests sustained weakness.
COMPQ just recorded a "bearish outside reversal week" (BORW). A BORW is a calendar week with a higher high, lower low, and lower close than the week prior. COMPQ basically did this over one trading session, from Monday's all-time high at 10,824.79 to Tuesday's weekly low at 10,182.46, a decline of -5.93% in 24 hours. However, Tuesday's low would record as the weekly low and COMPQ cleaned up most of the early week weakness by Friday's close. Nonetheless, COMPQ still recorded a BORW immediately following an all-time high weekly close the week prior. It reads like "distribution", but if history is any guide, it's anything but "distribution" and is instead just a shakeout of the weak hands.
Since 1980, there are 21 prior instances of COMPQ recording a two-week pattern of a BORW that declines no more than -3% immediately following an all-time high weekly close the week prior. Of those 21 instances, COMPQ closed higher two, three, and four weeks later 17 times. Average returns span from 1.40% over two weeks, to 2.40% over four weeks. The past isn't predictive of the future, especially when we live in unprecedented times, but the past can be used to dispel the idea that COMPQ's downside reversal this week is a bad omen...and that's exactly what COMPQ's history dispels.

Based on our work, it appears likely that the technology sector will find its footing over the weeks ahead, and if participants remain eager buyers of everything else (i.e., SPXEW stays at the SPX party) then it's likely that we're trading up into the 3300s and retesting all-time highs in the month of August. It looks like the bulls are ready to put the ball in the endzone - a pivotal remainder of July awaits.
S&P 500 Primary Trend - Neutral To Up?
There are 10 trading days left in the month of July for the S&P 500, and the index is in prime position to close the month at a new all-time high monthly close. The current all-time high monthly close is 3,230.78 from December of 2019. Given where the S&P 500 closed on Friday, we consider anything but a new all-time high monthly close in July a disappointment
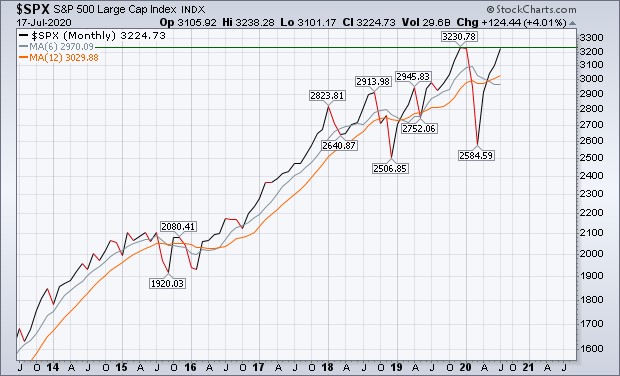
The index is presently higher by 4.01% for the month and is on pace to record a four- month winning streak. While we labeled the primary trend as "neutral" at the end of June, our work will label the primary trend as up or "bullish" should the month of July close at a new all-time high.
A top is a top until it's not, and an all-time high monthly close means it's not. It's in that scenario where there are then no known levels of resistance left on the charts.
During uptrends, long-term investors are generally best served investing in the most traditional sense of the word, maintaining an equity overweight across their portfolios' asset allocation and relying mostly on passive investing methodologies. Risk management is always a necessary component to a long-term investing plan, but it isn't until the primary trend can be labeled as down, or "bearish" (something we certainly thought was the case at the end of March) that long-term investors should be more concerned about the risk of losing money, rather than the risk of losing opportunity.
At the moment, it truly does feel as if there is more risk to being under-invested in stocks than there is being over-invested in stocks.
Given what's unfolding in the global economy, this makes about as much sense as either one of us waking up 6'2" tomorrow, but if you want a refresher as to why that doesn't matter please re-read the first section of last week's Update. It's not supposed to make sense.
As for the future being an uptrend for the S&P 500, we do have COMPQ recording a new all-time high here in the month of July. While the everyone knows the old phrase "sell in May and go away" for the S&P 500, nobody seems to know the phrase "an all-time high is a time to buy" for COMPQ.
COMPQ has recorded a new all-time high in the month of July twelve prior times since 1979, and the index has then never closed lower 12 months later. It's a perfect 12-0 to the upside for average returns of 19.15%. Following a new all time high for COMPQ in July, the index has generally been up, up and away.

Unless this time is different for COMPQ, the S&P 500 will have its best player putting up lots of points over the forward one year. If the cyclical sectors of the economy can sustain their bid, undoubtedly a derivative of more fiscal and monetary policy, there exists a great possibility of a broad advance over the forward one year. The narrative here will obviously have to include science getting the upper hand on the coronavirus, and we're starting to hear more and more about this reality (more to come from AstraZeneca on Monday).
Gold Says The Fed Will "Inflate or Die"
The late, great Richard Russell (click here) always said the true mandate of the Federal Reserve was "inflate or die". It was the idea that policy decisions would always err on the side of doing too much, and risking inflation, as compared to doing too little, and risking deflation. If Russell were alive today, he'd undoubtedly be using this phrase, as policy makers have not hesitated to bring forward trillions of dollars worth of stimulus, and there's seemingly more on the way (click here). He'd be terrified of the fact that the Chairman of the Federal Reserve was on 60 Minutes saying the following (click here):
PELLEY: Fair to say you simply flooded the system with money?
POWELL: Yes. We did. That's another way to think about it. We did.
PELLEY: Where does it come from? Do you just print it?
POWELL: We print it digitally. So as a central bank, we have the ability to create money digitally. And we do that by buying Treasury Bills or bonds for other government guaranteed securities. And that actually increases the money supply. We also print actual currency and we distribute that through the Federal Reserve banks.
Russell's terror would find safety in the price action of gold. Fundamentally, gold would seem to be the perfect hedge to the chaos of the world at the moment, especially the risk of reckless global central bank activity.
Narratives such as fiat currency devaluation, yield curve controls, excessive liquidity, rising political and geopolitical risks, social tensions and rising inequality all seem to provide a fundamental reason to support the idea of higher gold prices into the future. There's a potential crisis everywhere we look and gold has a history of thriving in crisis-like environments.
From a technical perspective, gold gained another 0.45% this week and has now increased 6 weeks in a row for the second time in 2020. The metal is higher by 7.55% the last 6 weeks and has gained 26.87% the last 52 weeks (more than 2.5x that of the S&P 500 the last 52 weeks). Like the S&P 500, gold is face-to-face with resistance.

However, prior 6-week winning streaks have not been kind to gold in the short term. Since 1970, gold has increased 6 weeks in a row 31 prior times, excluding overlapping samples. Following 6-week winning streaks, gold has then closed lower two, three, and four weeks later nearly 60% of the time. Since the turn of the century, gold has recorded fifteen 6-week winning streaks and the metal has then closed lower four weeks later 10 out of 15 times.

Gold would seem to have a bit of a headwind in front of it over the coming month.
However, recall that the month of July also began with a headwind for gold via a five- month winning streak, and that hasn't stopped the metal from being higher by 0.53% thus far for July, not yet at least. Should this headwind materialize, we believe gold will head back down toward the $1,750 price region, a test of past resistance (ideally becoming new support) along with its 50-day simple moving average.

Putting it all together, the fundamental story for gold remains supportive of higher prices and the price action of gold is that of a primary uptrend. We wrote earlier this year that we believed gold would see new all-time highs in 2020 and we still feel that way. Over the short term, we believe gold will likely face a headwind, bringing about a pullback in price, before then resuming the uptrend into the vaunted months of September and October for the S&P 500.
From a diversification perspective, gold remains a prudent piece of a well-diversified portfolio. We live in a time of radical uncertainty, both economically and in the prices of asset classes, and gold is a piece that can perform in the event the uncertainty manifests itself unfavorably.
Happy Sunday!
This material is being provided for client and prospective client informational purposes only. This commentary represents the current market views of the author, and Nerad + Deppe Wealth Management (NDWM, LLC) in general, and there is no guarantee that any forecasts made will come to pass. Due to various risks and uncertainties, actual events, results or performance may differ materially from those reflected or contemplated in any forward-looking statements. Neither the information nor the opinions expressed herein constitutes an offer or solicitation to buy or sell any specific security, or to make any investment decisions. The opinions are based on market conditions as of the date of publication and are subject to change. All data is sourced to stooq.com and stockcharts.com. No obligation is undertaken to update any information, data or material contained herein. Past performance is not indicative of future results. Any specific security or strategy is subject to a unique due diligence process, and not all diligence is executed in the same manner. All investments are subject to a degree of risk, and alternative investments and strategies are subject to a set of unique risks. No level of due diligence mitigates all risk, and does not eliminate market risk, failure, default, or fraud. It should not be assumed that any of the securities transactions or holdings discussed were or will prove to be profitable, or that the investment recommendations or decisions we make in the future will be profitable, or will equal the investment performance of the securities discussed herein. The commentary may utilize index returns, and you cannot invest directly into an index without incurring fees and expenses of investment in a security or other instrument. In addition, performance does not account other factors that would impact actual trading, including but not limited to account fees, custody, and advisory or management fees, as applicable. All of these fees and expenses would reduce the rate of return on investment. The content may include links to third party sites that are not affiliated with NDWM, LLC. While we believe the materials to be reliable, we have not independently verified the accuracy of the contents of the website, and therefore can't attest to the accuracy of any data, statements, or opinions.
