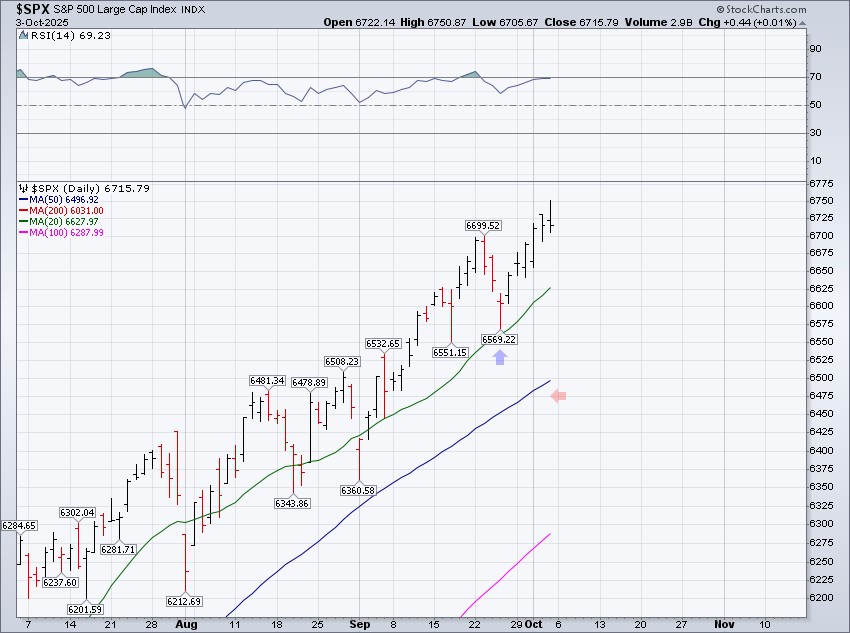
The S&P 500 gained 1.09% this week with Friday's close at 6,715.79. Friday's close is a new all-time high weekly close.
The index came out of the gates strong on Monday and never looked back. The S&P 500 increased every day this week and has now increased six days in a row, gaining 1.68% in the process. The index traded up to 6,750.87 during Friday's session before backing off into the close, a small sign of fatigue.
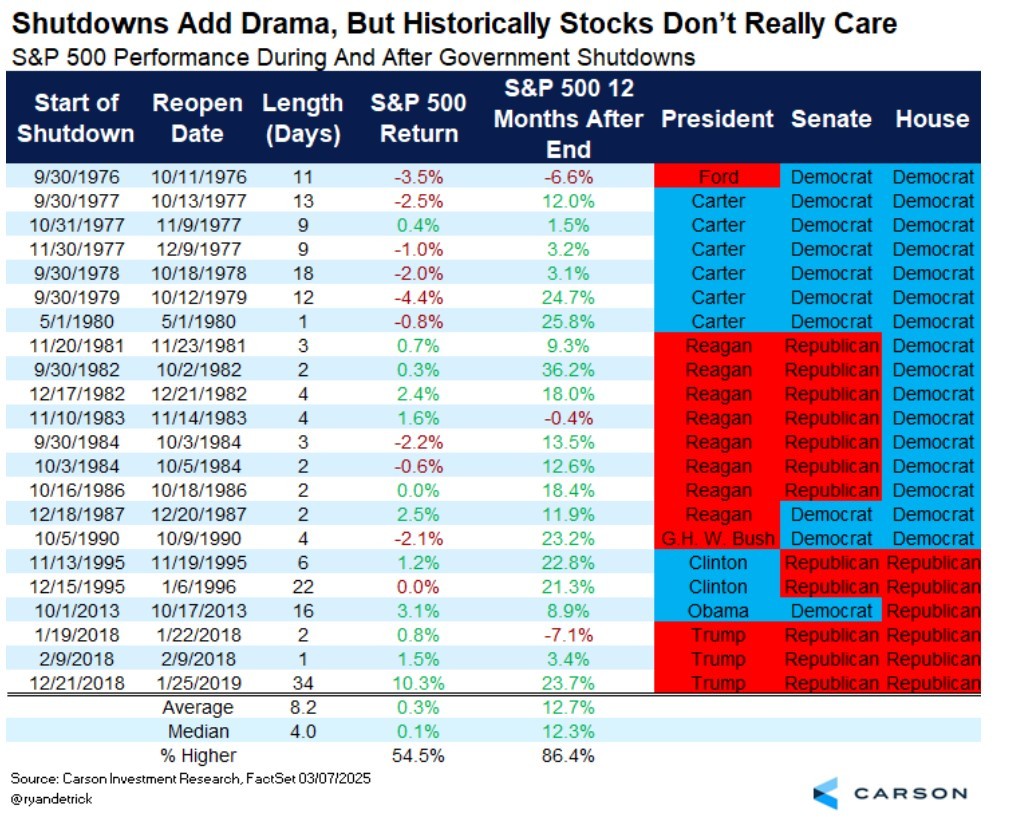
Ironically, all of this occurred as the government shut down (click here) and private jobs data suggests potential labor market weakness (click here). The "wall of worry" grew an inch larger this week, and that only adds fuel to the outlook for the S&P 500. In the world of stocks, it makes sense by not making sense.
Speaking of not making sense, Ryan Detrick of Carson Group shared how the S&P 500 has traded in all prior government shutdowns. On average, government shutdowns have been a giant nothing burger and anything but a harbinger of doom.
Market internals were fascinating this week as health care led the way, and we can't remember the last time we wrote that. The S&P 500 health care sector (SPHC) gained 6.82% this week, with Eli Lilly gaining 15.92% and Pfizer gaining 15.19%. The catalyst was a backdoor deal to get around pharmaceutical tariffs (click here).
The utilities and technology sectors both gained more than 2% this week too. Industrials and materials gained more than 1%, but the remaining six sectors within the S&P 500 all underperformed the index itself. Energy, the big winner from last week, gave back almost everything it gained last week by falling -3.35% this week. Overall, the S&P 500 equal weight index (SPXEW) outpaced the S&P 500 by 0.28% this week, so it was a good week for the market of stocks...and the stock market!
A few other areas of interest across the stocks asset class:
- International stocks continue to shine. The iShares MSCI All-Country World Index Ex USA (click here) gained 2.76% this week, far outpacing the S&P 500 itself.
- Emerging markets deliver new all-time highs. The iShares MSCI Emerging Markets Index (click here) finally hurdled its peak from 2021, trading into the $53's and $54's this week.
- Small-cap stocks continue to rise. The iShares Russell 2000 Index (click here) gained 1.86% this week and increased for the eighth time over the last nine weeks.
Zooming over to the bond market, bond prices rose this week and interest rates fell across the curve. The yield on a 10-year United States Treasury bond (UST10Y) closed Friday at 4.12%.
Participants still expect the Fed to cut interest rates two more times here in 2025, cutting -0.25% off the federal funds rate at their meetings on 10/29 and 12/10. The yield curve will steepen further in response, a classic "bull steepener" (click here). From a valuation standpoint, we continue to believe municipal bonds are incredibly attractive. The iShares National Municipal Bond Index (click here) currently sports an SEC 30-day yield of 3.38%, and that's federally tax-exempt. With the yield on a 5-year Treasury bill closing Friday at 3.72%, that's pretty darn attractive in our view.
Finally, gold's heater carried on this week. Gold gained 3.11% this week with Friday's close at $3,885.77. The metal has now increased seven weeks in a row, gaining 16.47% in the process. Gold's now up a massive 48.06% year-to-date in 2025, easily its best performing year since the 1970s. Reminds us of "I love Gold!" (click here).
As for the week ahead, the government shutdown will continue to delay certain data releases, so the week ahead will focus mostly on the plethora of Fedspeak on the calendar. We'll hear from Fed Chair Powell on Thursday, and maybe one day this week we'll actually see an end to the government shutdown. The primary trend across all time frames is bullish, so the path of least resistance remains to the upside.
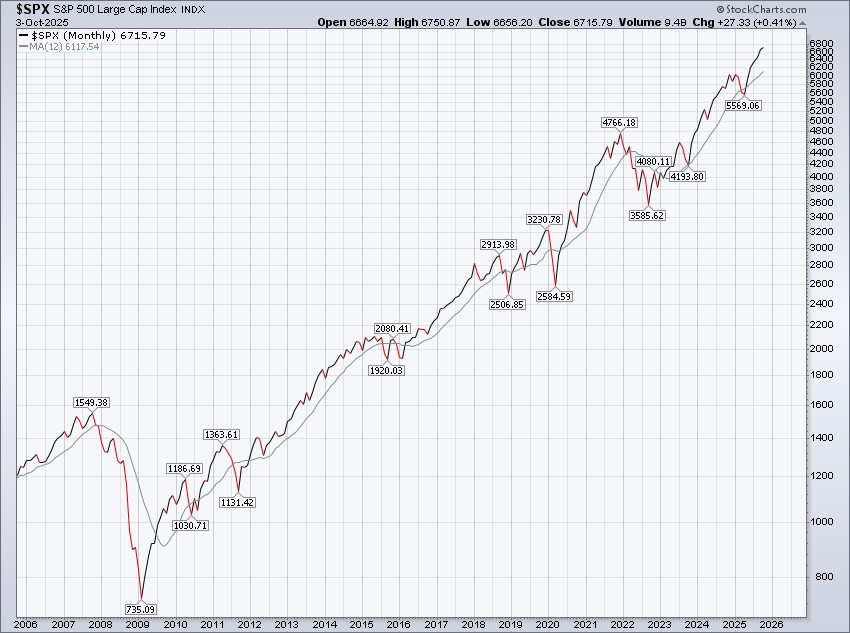
S&P 500 Primary Trend - Up
The S&P 500 finished the month of September on Tuesday this week, closing at 6,688.46, a gain of 3.53% for the month. September's monthly close is a new all-time high monthly close and marks a five-month winning streak for the S&P 500.
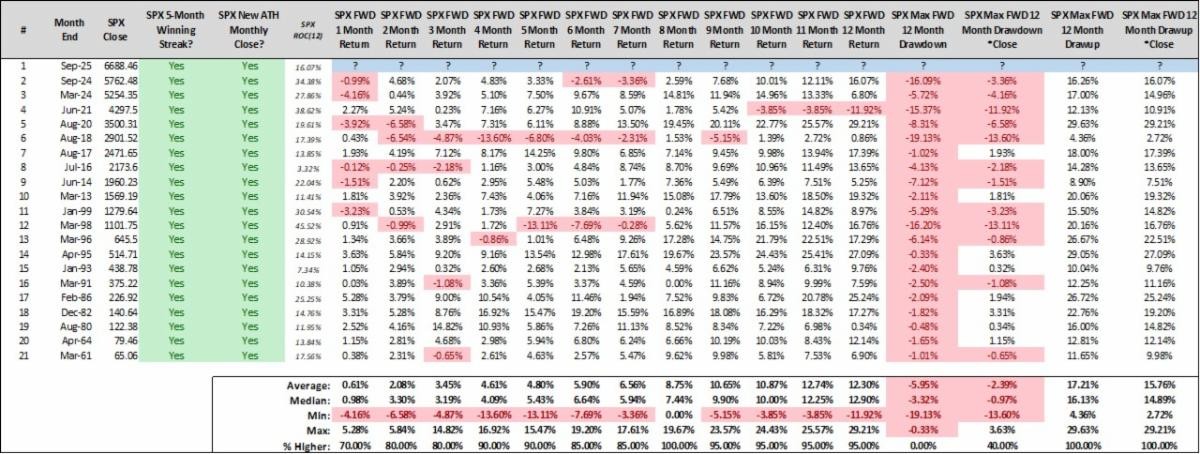
As always, this guarantees us absolutely nothing about the future, and the past can't be used to consistently predict the future. That said, it teaches us that this can continue, meaning the S&P 500 can continue to rise into the future - no matter how strong the last five months have been. Anyone who is telling you the last five months are a sign of trouble to come is misinformed. Trouble certainly could come, anything is always possible, but it won't be because the month of September closed at a five-month winning streak and a new all-time high monthly close.
Our work continues to label the S&P 500's primary trend as up, or "bullish".
Generally speaking, during uptrends long-term investors are best served implementing and maintaining an equity overweight across their portfolios' asset allocation and relying mostly on passive investing methodologies. It's time in the market that breeds success during primary uptrends for the S&P 500, with the last few months being a great example. The goal is to "be right and sit tight" and ride the market's wave to the upside.
Happy Sunday!
Steve & Rick