The S&P 500 declined -3.31% this week with Friday's close at 3,714.24.
The index traded up to a new all-time high at 3,870.90 on Tuesday, only to then fall -4% into Friday's close. Resistance has now firmly solidified itself in the ~3,870 region, and the "magical support" via the 20-day simple moving average ran out of magic on Friday. Friday's close did leave the index face-to-face with its 50-day simple moving average, another obvious level of potential "support", but the price action this week would seem to jive with the idea of further turbulence over the coming one month.

We like to remind our readers that prices don't move linearly forever.
This means that our baseline expectation as investors is to understand and embrace the elements of "mean reversion", or the belief that a portion of great returns in the recent past always have to be paid back in the not too distant future. While we did not anticipate this week's sharp downside reversal and it is fairly unique in nature, we do understand that a -4% pullback after a near 20% rally the prior 3 months is totally normal...because prices don't move linearly forever.
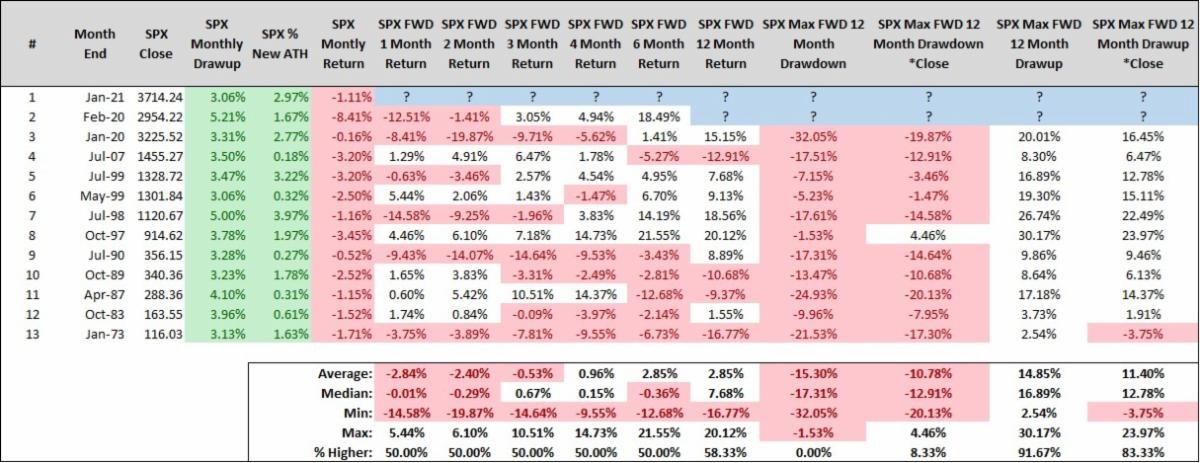
Looking forward, if we quantify this week's price action we can find supporting evidence that suggests things will stay volatile over the month of February.
We can define this past week as a calendar week that declines -3% or more during an uptrend (i.e., positive returns over the trailing 12 weeks) that closes within -10% of our all-time high weekly close.

The sequence of which price level comes first is obviously the great unknown. Any trade down toward ~3,550 sooner rather than later would feel like the world is ending, but it would leave the price of the S&P 500 nicely "oversold" and in a gigantic confluence of support (red shaded region on the first chart we shared). That could then be the catalyst to spark a rally back toward the ~3,830 region the back half of February (ideally after there's more clarity regarding the systemic implications of stocks like GameStop climbing from ~$15 to ~$500 in a month's time).
Speaking of GameStop (GME), is there a better example of the market trading beyond the limits of imagination? We're not so sure.
How on earth did GME climb ~400% this week? We truly don't know and there's a variety of explanations out there, but the one that makes the most sense to us lies in the dynamics of simple supply and demand; the demand to own GME is through the roof.
Broadly speaking, everyone and their mother is seemingly buying GME stock and derivatives tied to further upside in GME stock (call options). From sophisticated professionals masked as "dumb money" on Reddit forums, to unsophisticated speculators who epitomize the phrase "dumb money", to market makers making an absolute fortune on GME's volume, to hedge funds losing billions (click here) being forced to buy GME to cover their short position. Seemingly, everyone is buying GME and GME's price is behaving accordingly, albeit shockingly.
This has uncovered plumbing issues within market structure, fears that are probably overblown, and created a crisis of confidence across the viability of brokerages who are now facing a sort of modern-day "bank run" (click here), which we find very concerning. However, all of the subsets of participants involved in GME are acting in their own self interests, and rightfully so in our opinion.
Those speculating in GME, from the sophisticated to the unsophisticated, shouldn't be blamed. They're simply putting capital at risk the same way hedge funds put capital at risk via shorting GME into oblivion the last few years. One group was simply a lot "smarter" than the other and it wasn't the hedge funds. The counterpunch always wins!.
Shorts covering shouldn't be blamed either; how else should they manage this sort of predicament? Market makers are doing what's expected, making markets, and brokerages (i.e., the Robinhoods of the world) are simply protecting their ability to keep the lights on.
So, while there is something "broken" with the price of GME rising ~400% in a week, we're not exactly sure what needs to be fixed, and additional regulation is probably not the answer since regulation plays a role in what's happening in the first place (click here). If anything, the problem will probably fix itself; hedge funds will think twice, and a third time, before shorting stocks into oblivion ever again. And after GME comes back to planet earth, speculators will think twice, and a third time, for believing they found the holy grail. Ultimately, both parties will learn valuable lessons in risk management.
Ironically, many of our readers could also be benefiting from the meteoric rise in GME. GME is now the fourth largest holding within the iShares Russell 2000 index fund, ticker symbol IWM (click here). While IWM declined -4.39% this week, it would have declined more if GME didn't gain ~400%! This can certainly go the other direction if GME's price comes back to earth into the future, but the point is more people have exposure to GME than they otherwise knew.
S&P 500 Primary Trend - Up
The S&P 500 finished the month of January this week, and this week's decline turned a positive month into a negative month.
The index declined -1.11% for the month, after having traded higher by more than 3% from December's monthly close during the month. It's through those lenses where January is a sort of reversal month, and that sort of "distribution" always gets our attention. To be clear, the primary trend remains up, or "bullish", and one bad week can't erase months of progress. However, as the saying goes "all's well that ends well"...and January didn't end well.

Quantifying the price action in January reveals a mixed bag. Since 1970, there are twelve prior calendar months that traded higher by 3% or more during the month to a new all-time high and yet closed the month in the red. Ironically, this was the exact same position we found ourselves in one year ago.
Looking forward, we continue to believe long-term investors are best served investing in the more traditional sense of the word.
The recipe for success during primary uptrends is generally an equity overweight across a portfolio's asset allocation and relying mostly on passive investing methodologies. It isn't until the primary trend can be labeled as down, or "bearish", that long-term investors should consider prioritizing capital preservation over capital appreciation. Remember, in the world of long-term investing, "risk cannot be destroyed, only transformed" (h/t Corey Hoffstein).
Long-term investors constantly have to evaluate what risk is worth taking - the risk of losing too much money (i.e., investing too aggressively during primary downtrends) or the risk of losing opportunity (i.e., investing too conservatively during primary uptrends). Remember, all long-term investors can choose is the primary risk they're willing to accept, nothing more. In the world of investing, returns are only expected, but risk is guaranteed.
At the moment, the bigger risk over 2021 seems to be the risk of investing too conservatively during a primary uptrend. Much of the narrative for why stocks should head to the north during 2021 remains in place, even with the the seat belt light on in the short term given the chaos associated with GME and Robinhood.
January Updates: Banks Fumble At The 1, Gold At Critical Spot, Bitcoin The GME Beneficiary?
A few updates to some charts we shared in January:
The S&P 500 Financial Index (SPF) closed January down -1.93%. SPF set a new all-time high in January and appeared to be on the verge of breaking out above multi-decade resistance. But, SPF pulled a Desean Jackson and fumbled on its way to the end zone (click here).

Gold finished January down -2.36%. Gold remains backtesting prior levels of resistance, and the idea here is that past resistance becomes future support. For that idea to be correct in this instance, gold is going to need to step on the gas. Maybe the Redditors' newfound love of silver (click here) will spill over into gold.

BItcoin (BTC) has cooled off of late after a furious rally, but the runway is still mostly clear here. BTC is now consolidating between ~$30,000 and ~$40,000 as it corrects through time following its massive sprint from ~$20,000 to ~$40,000. The 50-day simple moving average (solid blue line) has been support twice during this most recent consolidation phase, so we'd like to continue to see eager buying interest into lower prices for BTC over the month of February.
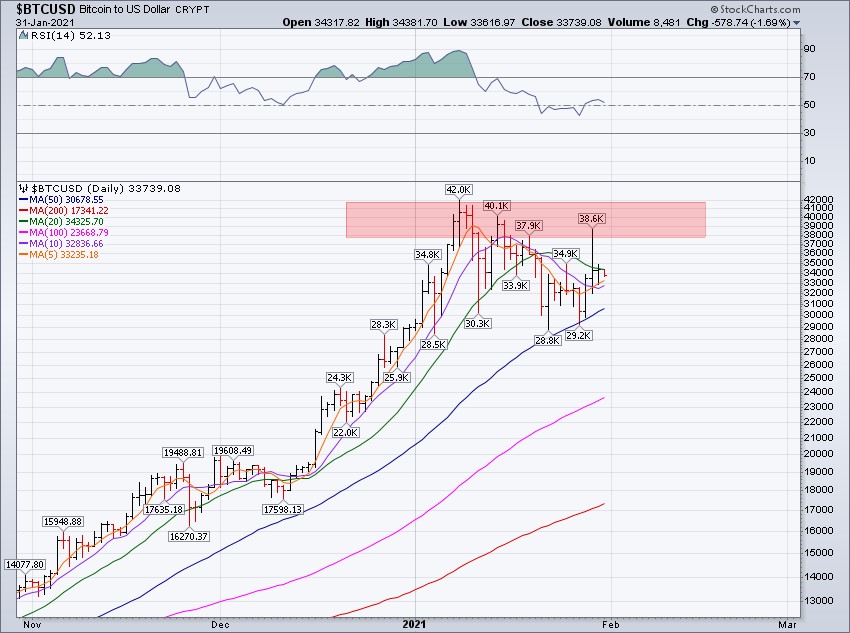
From a fundamental perspective, the chaos surrounding GME appears to be another problem BTC can fix. While we say that with sarcasm, there is a narrative here that will gain momentum in the event Robinhood can't keep its lights on...(click here).
Happy Sunday!
Steve & RickThis material is being provided for client and prospective client informational purposes only. This commentary represents the current market views of the author, and Nerad + Deppe Wealth Management (NDWM, LLC) in general, and there is no guarantee that any forecasts made will come to pass. Due to various risks and uncertainties, actual events, results or performance may differ materially from those reflected or contemplated in any forward-looking statements. Neither the information nor the opinions expressed herein constitutes an offer or solicitation to buy or sell any specific security, or to make any investment decisions. The opinions are based on market conditions as of the date of publication and are subject to change. All data is sourced to stooq.com and stockcharts.com. No obligation is undertaken to update any information, data or material contained herein. Past performance is not indicative of future results. Any specific security or strategy is subject to a unique due diligence process, and not all diligence is executed in the same manner. All investments are subject to a degree of risk, and alternative investments and strategies are subject to a set of unique risks. No level of due diligence mitigates all risk, and does not eliminate market risk, failure, default, or fraud. It should not be assumed that any of the securities transactions or holdings discussed were or will prove to be profitable, or that the investment recommendations or decisions we make in the future will be profitable, or will equal the investment performance of the securities discussed herein. The commentary may utilize index returns, and you cannot invest directly into an index without incurring fees and expenses of investment in a security or other instrument. In addition, performance does not account other factors that would impact actual trading, including but not limited to account fees, custody, and advisory or management fees, as applicable. All of these fees and expenses would reduce the rate of return on investment. The content may include links to third party sites that are not affiliated with NDWM, LLC. While we believe the materials to be reliable, we have not independently verified the accuracy of the contents of the website, and therefore can't attest to the accuracy of any data, statements, or opinions.
