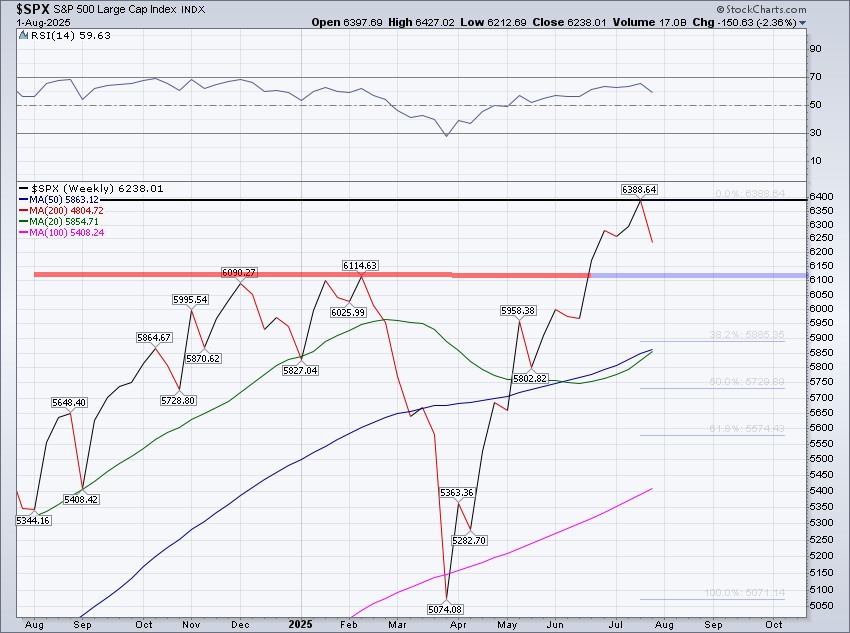
The S&P 500 fell -2.36% this week with Friday's close at 6,238.01. The index opened Thursday's session at a new all-time high at 6,427.02, but that's where the S&P 500 decided to slam on the brakes. We finished Thursday's session back down at 6,339.39, a decline of -1.36% during Thursday's regular trading hours. The index then fell -1.60% on Friday, marking a two-day pullback of -2.94%.
If you've read either of our last two Updates, then you know we don't find this volatility surprising. In last week's Update we wrote:
"Now - we discussed this in last week's Update - we do believe the picture for the S&P 500 is unchanged from last week's Update. We think the ingredients are there for downside volatility in the price of the S&P 500 at some point in the month of August. We believe this pullback, or downdraft, would be normal, healthy and welcomed. Given the sprint the S&P 500 has been on since early April, this retracement will serve to recharge the battery for a strong finish to 2025. In other words, don't fall in love with your account balances as a portion of incredible returns in the not too distant past always have to be given back to the house in the not too distant future. Every heater runs its course, and prices don't move linearly forever!"
Part of the reason why the first section of our weekly commentary attempts to discount the near-term price action for the S&P 500 is to keep our clients plugged into what might unfold for the S&P 500. This is analogous to a pilot warning passengers about any impending turbulence - it helps them stay calm and not panic if the turbulence actually arrives. We like to think that the price action on Friday was a pinch easier to stomach for anyone who read what we wrote last week.
So, the trillion-dollar questions now are twofold:
- At what price, and when, will the S&P 500 bottom, marking the end of this pullback?
- When will the S&P 500 trade up to a new all-time high?
Both of these questions are unanswerable, or they're best answered as "nobody knows". But where's the fun in that?
We believe the S&P 500 will trade down to the ~6,000-6,100 level for a "bottom" here in August or September.
Now, every market technician and technical analyst across the globe has drawn horizontal lines noting "resistance" through the following levels:
- 6,427.02, our current all-time high.
- 6,389.77, our current all-time high daily close.
- 6,388.64, our current all-time high weekly close.
A top is a top until it's not, so we have some form of a top on the chart above. We've added a thick horizontal black line through the 6,388.64 level to mark this week's "resistance". Therefore, our answer to question two from above is...the fourth quarter of 2025. Investors will need to put their "patient hats" on.
Broadly, we believe the S&P 500 is stuck, or range-bound, and expect it to trade between the ~6,000-6,400 levels for the coming four to six weeks.
It's only a ~6% range, so it's a bit narrow and a relatively "safe" call, but it jives with the idea that the S&P 500 needs a breather. We've been ripping higher for months, with hardly any pauses or pullbacks, and we're now entering an unfavorable period of the year. In terms of price action, the ingredients to be "stuck" are all there.
Fundamentally, the ingredients to be "stuck" are all there too. Trump's trade war continues on, Friday brought a weak jobs report, inflation showed a pulse this week and the Fed now seems ready to cut in September after holding steady on Wednesday. No wonder the Volatility Index climbed almost four full percentage points on Friday alone, finishing the week back above the 20 level.
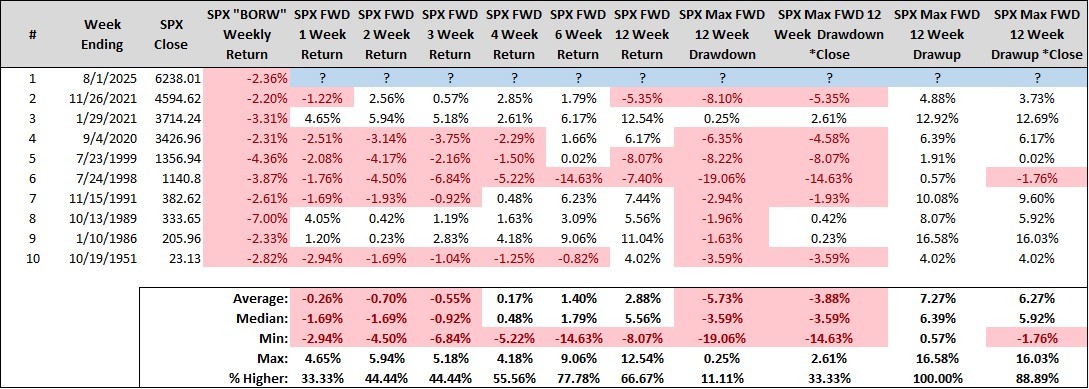
Shifting gears back to the price action, the S&P 500 recorded a "bearish outside reversal week" (BORW) this week. BORW's are defined as a calendar week with a higher high, lower low, and lower close than the week prior. This leaves the open-high-low-close (OHLC) bar on the weekly chart "outside" of the prior week's. What makes this BORW a bit different is the fact that the "higher high" is an all-time high, combined with a weekly return of -2% or more. When combing through our S&P 500 dataset we can observe that BORW's from all-time highs, and those that decline -2% or more, are incredibly rare.
Since 1970 we have just nine calendar weeks that match what we saw this week (BORW, all-time high, weekly loss of -2% or more).
Interestingly, the S&P 500's traded with a negative skew over the forward one, two, and three weeks. We can observe that by week six and week 12 the picture turns decidedly more white on the chart below. The average maximum forward 12-week drawdown and drawup ring in at -5.73% and 7.27%, which would set a range between ~5,880-6,691. This covers us all the way until early November so we're OK with this, especially if it's ~5,880 in September and ~6,691 in early November!
Some other items of note from this past week:
- Exactly one sector closed in the green this week - the utilities sector. Utilities have now closed higher six weeks in a row. Every other sector fell by more than -1% this week.
- Microsoft beat on earnings (click here). The stock has now closed higher 10 weeks in a row, and 14 of the last 15 overall. However, the stock closed down more than -5% off its weekly high so "resistance" has finally revealed itself.
- Meta beat on earnings too (click here), but the stock remains unchanged from early 2025.
- Gold did its thing, gaining 0.75% this week (and 2.25% on Friday alone). If stocks are going to fall, gold has to earn its keep by moving inversely. It did just that this week.
- Bonds caught a bid this week, especially on Friday, as bond prices jumped and yields plunged across the yield curve. The yield on a 10-year United States Treasury bond fell 17 basis points, finishing the week at 4.22% after trading at 4.42% earlier in the week. We continue to view municipal bonds as the single most attractive area of the fixed-income markets.
As for the week ahead, it's a relatively light week on the economic data front, so earnings season will play a more material role in shaping the narrative. Regarding price action, "inside weeks" aren't the norm so we'd look for the S&P 500 to trade down below Friday's low at 6,212.69, ideally early in the week. Volatility's back, so the numbers on your screen are going to start moving bigger and bigger, and in both directions. The seat belt light is on, but stay calm...it's only temporary! Another exciting week awaits!
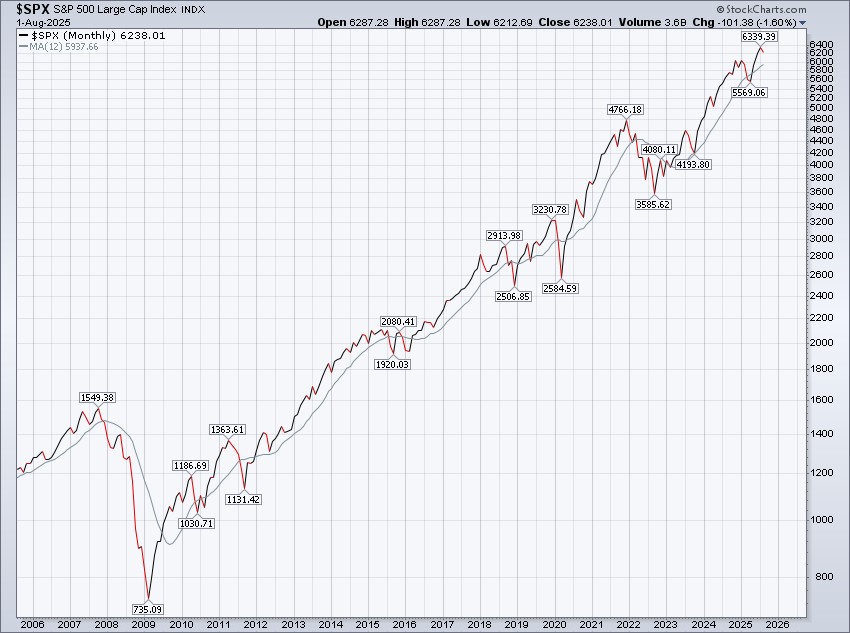
S&P 500 Primary Trend - Up
The S&P 500 finished the month of July on Friday, gaining 2.17% and closing at a fresh all-time high monthly close. The index has now increased three consecutive months, and increasing a massive 13.83% (and this was after a massive upside reversal during the month of May!). To say we've gone streaking is a bit of an understatement. The S&P 500 is on fire, like Steph Curry from deep in practice.
The S&P 500 finished the month of July on a three-month winning streak, at a new all-time high monthly close, and with trailing three-month returns of 10% or more.
After a streak like this, it's human nature to believe that "this can't continue". After all, prices don't move linearly forever. However, three-month periods like this have actually been far more supportive of the idea that this can continue, rather than this can't continue.
Since 1960, we have 15 prior three-month winning streaks that match this exact criteria. The S&P 500 has then closed higher the majority of the time across all intervals referenced in the table below. Now, we'd be remiss in not pointing out that the only other July on the list is July 1987, but overall this study supports the idea that "strength begets strength" over the coming 3-6-12 months.
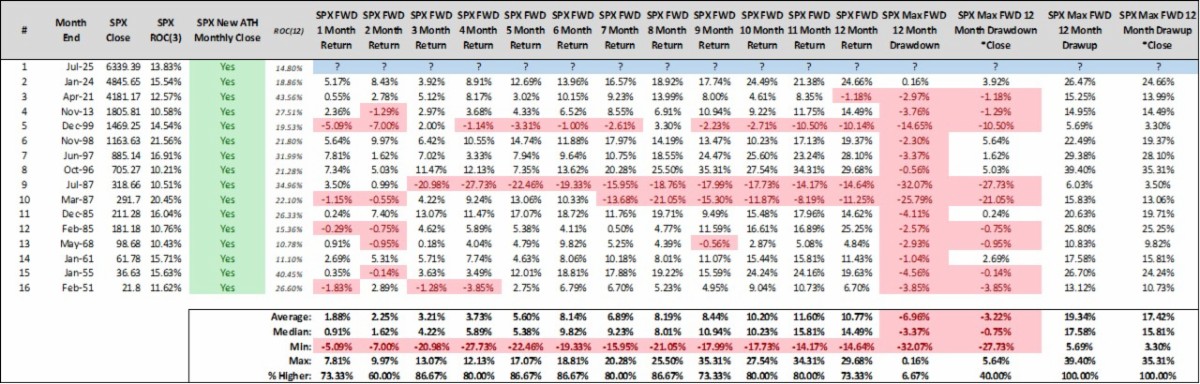
While the forecast for the S&P 500's returns over the coming year look bright, the forecast for the index's returns in August look a bit murky, as we've discussed of late.
There is absolutely nothing wrong with the S&P 500 declining in the month of August (should it happen). Nobody would bat an eye if Steph Currey missed a three-pointer after making 100+ in a row, and nobody should bat an eye if the S&P 500 takes a breather after the heater it's been on. Any decline in August is likely temporary and only an interruption of our "bull market", it will not end it.
It goes without saying, but the primary trend for the S&P 500 is up, which means long-term investors should strive to keep it simple and straightforward and "be right and sit tight". It's worked for a long, long time and if it isn't broke...don't try to fix it. Just sit back and enjoy the ride, even if things get a bit bumpy in August.
Happy Sunday!
Steve & Rick
