We hope you stayed safe and had a great holiday weekend!
The S&P 500 was basically unchanged this week, falling -0.17% with Friday's close at 3,703.06.
While it was a holiday-shortened trading week, there was meaningful volatility to start the week.
We traded down to 3,636.48 on Monday, a decline of -1.97% from last Friday's close, only to then finish the day back at 3,694.92, a rally of 1.60% from Monday's low. Given the stimulus news that was announced last weekend (click here), it was a "sell the news" type of session at Monday's lows. But the selling pressure abated and the rest of the week then saw typical holiday trading (i.e., it was as if the market was asleep). We ultimately finished the week right back where we started.
Interestingly, Monday recorded the low of the week yet again. Four out of the last five trading weeks have now recorded their weekly low on Monday, furthering the narrative of eager buying interest overwhelming any semblance of selling pressure. It's as if participants can't wait to buy 'em as soon as the market opens on Monday, especially if we're in the red.
Looking forward, the picture remains mostly unchanged. After recording a -10% correction during the months of September and October, the index has now reversed course and broken out to the upside. While the price action in December has mostly seen the index idle in neutral (virtually all of the month's advance is concentrated in the first four trading days of the month), we're yet to see any meaningful signs of selling pressure, or "resistance".
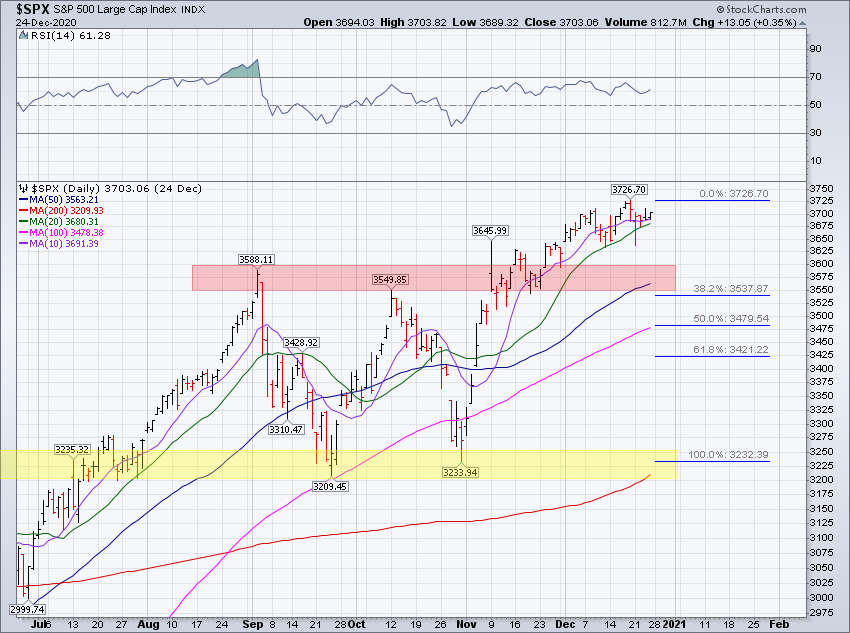
Ironically, December has left more intermediate "support" on the charts. The S&P 500's weekly lows here in December record at 3,633.40, 3,645.84, and 3,636.48. If the chart above could talk, it's as if it would be saying there is eager buying interest and a seller's strike unfolding all at the same time the last month-plus. We've written a lot about how the S&P 500 has developed a tendency to trade as if there is an "on/off" switch the last few years, mostly when the market turns "off". Well, the switch got turned "on" in November.
From a sector perspective the financials were the big winner this week, with the S&P 500 Financials Sector Index (SPF) gaining 1.94%.

The energy sector (SPEN) was the big loser again this week, falling -2.03%.
SPEN accounts for just 2.34% of the S&P 500, so it's not really going to move the needle. Like SPF, SPEN has been a dog for a long, long time. Every turn of the year will always find us wondering "Is next year the year for energy?".
On an annual basis, SPEN has lagged the S&P 500 eight of the last nine years, with 2020 being the worst year of underperformance at a gigantic -45.09%. Eventually SPEN will find a pulse, we think. Maybe 2021 is the year.

We'll finish the S&P 500's book on 2020 over the week ahead. There are four trading days remaining in what we'd call the craziest calendar year we've ever witnessed, (but do keep in mind our combined age isn't even 100). This year solidifies our belief that the price of the S&P 500 trades beyond the limits of imagination, so there's no telling what's coming in 2021.
S&P 500 Primary Trend - Up
Our work continues to label the primary trend for the S&P 500 as up or "bullish".
During uptrends, long-term investors are best served investing in the most traditional sense of the word. You don't need anything fancy during uptrends; less is generally more.
During uptrends for stocks, the primary risk to long-term investors is not making enough hay while the sun shines. In other words, investing too conservatively during primary uptrends exacerbates opportunity loss. While opportunity loss is a prudent risk to accept when the primary trend for the S&P 500 is down, or "bearish", or even trendless, it's not a prudent risk to accept when the primary trend for the S&P 500 is up. This is not to suggest long-term investors are all best served allocating 100% of their investable portfolio toward stocks. Individual investor attributes play a meaningful role in portfolio construction. But if your target asset allocation calls for 75% in stocks, then we believe you should be investing 75% in stocks. If you don't, primary uptrends will make sure you wish you did.

Assuming we don't crash over the coming four days, the S&P 500, including dividends, will have increased 11 out of the last 12, and 16 out of the last 18 years. Heck, there are only 6 down years since 1988, meaning the S&P 500 is on pace to be 27-6 over that time span. Those are win rates of 92%, 89%, and 82%. Equate that to the world of sports and that's a near unbeatable team. But that's also hindsight bias, and we all know what's happened in the past, and that it's a crime of small numbers. Looking back 100 years, and not 20, the past also suggests that it's unreasonable to expect the S&P 500 to continue to rise ~90% of the time, as it has the last 18 years.
Naturally, the success of the last decade leaves our brains mostly wired to believe this will all end badly and likely starting tomorrow. If we walk up to a roulette wheel and watch 11 spins turn up red, our natural inclination is to think the next spin is going to turn up black. We even write that prices don't move linearly forever, and the last 12 and 16 years are darn close to linear.
Perhaps this is why it's popular to believe that our decade-long "bull market" is destined to leave us in tears and bring about the nastiest of "bear markets". After all, valuations are at nosebleed levels and market manipulation via global central bank interference is at an all-time high (so the bears would say). There are probably major unintended consequences to pay given the actions of global central banks the last decade, but who's to say when we'll actually be required to start paying them.
John Hussman, a truly brilliant mind on Wall Street, has written about this ending badly for years, maybe even a decade (click here for his latest). He has to be stunned we're not already mired in a nasty "bear market". His argument is always compelling, it's always articulate, it's always convincing. But it's been remarkably inequitable for long-term investors who have acted on his warnings, as well as his shareholders. Now, the point is not to disparage Hussman, we truly believe he is as bright as anyone on Wall Street. Instead, the point is to emphasize that nobody, not even someone as bright and credentialed as Hussman, truly knows when or at what price our "bull market" will end. There is nothing that says the S&P 500 can't have a wonderful year again in 2021.
Thankfully, long-term investors don't need to know when our "bull market" will end in order to invest for success over time. Instead, they just need to be smart enough to have a plan (those who don't are planning to fail), and smart enough to tune out the noise, and smart (or dumb) enough trust the process (i.e., stick to the plan). When it comes to investing, the more you think you know, the more you'll want to then deviate from your plan. The less you think you know, the more you'll actually want to stick to your plan. Anything is always possible. The recipe to navigating the curve lies in a rules-based, mostly systematic, investing plan.
Looking forward, we implore all of our readers to have a plan, to have a long-term investment policy statement. Great things aren't born out of winging it, so make sure you aren't just winging it with your portfolio.
In our opinion, the best and most durable of investing methodologies into 2021 diversify "how" they invest in stocks.
They incorporate both active and passive investing methodologies, from asset allocation to security selection and even rebalancing decisions. They recognize there is absolutely no "right" answer in the world of long-term investing, but they firmly believe that the wrong answer for long-term investors is to put all of your eggs entirely into one basket or strategy. That's investing as if you know what's coming, and as we mentioned earlier, nobody knows what's coming.
Booming Bitcoin, Booming Small Caps, and Rising Interest Rates?
Some random holiday happenings across the investable universe:
Bitcoin's Booming

Small-Cap Stocks Continue Their Rampage
The iShares Russell 2000 ETF (ticker symbol IWM) gained 1.88% this week with Friday's close at $199.01.

Interest Rates Ready To Boom, Too?
The yield on a 10-year United States Treasury bond (UST10y) has been hovering around 0.90% for weeks now. The overall pattern just looks "bullish", and if market participants are bidding equities under the expectation of an "economic bonanza" into 2021 (as the price action in small caps would seem to suggest), then it would make sense for interest rates to follow suit to the upside. The question then is whether or not the Fed brings yield curve controls into the picture in 2021...

Happy Sunday!
Steve & RickThis material is being provided for client and prospective client informational purposes only. This commentary represents the current market views of the author, and Nerad + Deppe Wealth Management (NDWM, LLC) in general, and there is no guarantee that any forecasts made will come to pass. Due to various risks and uncertainties, actual events, results or performance may differ materially from those reflected or contemplated in any forward-looking statements. Neither the information nor the opinions expressed herein constitutes an offer or solicitation to buy or sell any specific security, or to make any investment decisions. The opinions are based on market conditions as of the date of publication and are subject to change. All data is sourced to stooq.com and stockcharts.com. No obligation is undertaken to update any information, data or material contained herein. Past performance is not indicative of future results. Any specific security or strategy is subject to a unique due diligence process, and not all diligence is executed in the same manner. All investments are subject to a degree of risk, and alternative investments and strategies are subject to a set of unique risks. No level of due diligence mitigates all risk, and does not eliminate market risk, failure, default, or fraud. It should not be assumed that any of the securities transactions or holdings discussed were or will prove to be profitable, or that the investment recommendations or decisions we make in the future will be profitable, or will equal the investment performance of the securities discussed herein. The commentary may utilize index returns, and you cannot invest directly into an index without incurring fees and expenses of investment in a security or other instrument. In addition, performance does not account other factors that would impact actual trading, including but not limited to account fees, custody, and advisory or management fees, as applicable. All of these fees and expenses would reduce the rate of return on investment. The content may include links to third party sites that are not affiliated with NDWM, LLC. While we believe the materials to be reliable, we have not independently verified the accuracy of the contents of the website, and therefore can't attest to the accuracy of any data, statements, or opinions.
