The S&P 500 gained 0.19% this week with Friday's close at 3,483.81.
The index has now increased three weeks in a row after having declined four weeks in a row and after recording a five-week winning streak. A five up, four down, three up pattern doesn't mean anything, but goes to support the theory that modern price action seems to have an on/off switch.
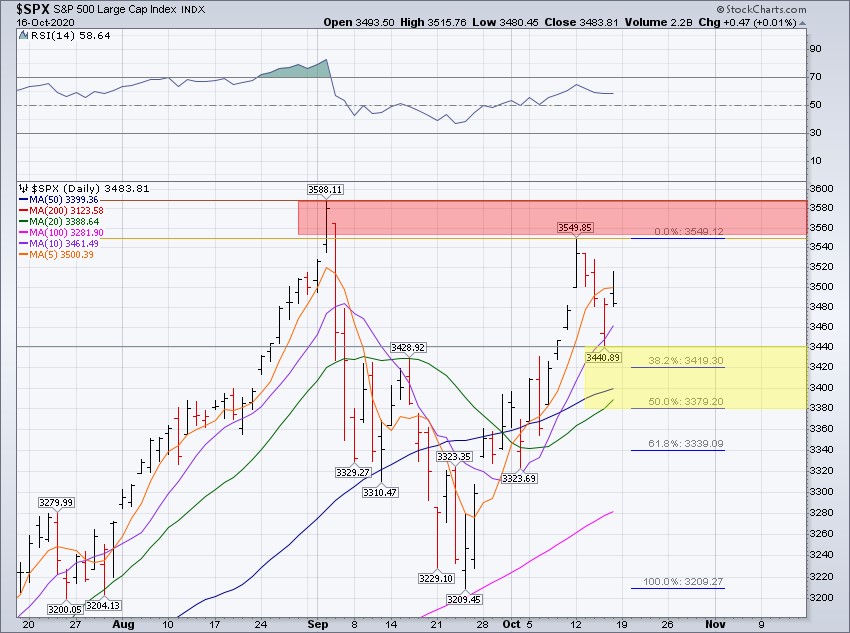
Friday's close is the second highest weekly close in the history of the index. The S&P 500 traded as high as 3,549.85 on Monday, a price we've only eclipsed on two prior trading days (September 2nd and 3rd). The emphasis of last week's Update was the index "retesting" our all-time highs at the ~3,580 price region. However, the index never made it there. Following Monday's high it was all red from there, similar to the days immediately following September 2nd and 3rd, as the S&P 500 basically declined the remainder of the trading week, sans Friday's 0.01% gain.
This week recorded as a stalemate, with the narrative appearing as healthy price consolidation.
On one hand we saw resistance from the ~3,549.85 price region, on the other hand we saw support at the ~3,440.89 price level. At Thursday's low, the S&P 500 was down -3% from Monday's high, a sharp, quick -108.96 point reversal. But if this week was truly a sign of eager selling pressure across the actions of market participants, we should (and would) have seen the S&P 500 trade down toward the ~3,400 price level on Thursday...not reverse to the upside back toward the ~3,500 price level. The late selloff on Friday makes it interesting as far as who has the ball as we enter the week ahead, but we tend to believe the advantage lies with the bulls.
There are just ten days left in the month of October, which means there are just twelve business days left until the election.
The obvious forecast is for the S&P 500 to trade within those shaded regions on the chart above, and then kick into overdrive one way or the other following the election. Ironically, if you're a Biden supporter you probably think the market will "crash" in the event Trump is re-elected, and if you're a Trump supporter you probably think the market will "crash" in the event Biden is elected. The historical reality, however, is that the election is mostly all bark and little bite. There's no discernible edge one way or the other.

Some observations:
- The final ten days of October have seen the S&P 500 trade higher eight of twelve years for average returns of 1.27%.
- The market absolutely ripped higher ahead of the election in year 2000, gaining 5.88% the final ten trading days of October.
- Conversely, the largest decline ahead of the election was -3.08% from 1980.
- The S&P 500 has only "crashed" once around the election, and that was in 2008. The "Great Financial Crisis" may have trumped the election, no pun intended.
Interestingly, we can also observe the S&P 500's tendency to reverse course following the election.
In 2000, the S&P 500 declined -6.12% the first twenty days of November, giving back everything the index gained prior to the election. Perhaps this was influenced by the controversy surrounding the election (click here).
In 1980, the S&P 500 roared 7.45% the first twenty days of November, recovering all of the selloff over the final ten days of October.
Continuing with the pre- and post-election reversal theme, the S&P 500's return over the final ten days of October and the first twenty days of November has been an opposite color nine of twelve instances. That is, the S&P 500 gained over the final ten days of October eight times, and it subsequently declined the first twenty trading days in November five times. In all four instances where the S&P 500 declined the final ten days of October, the index then went on to gain over the first twenty days of November. While there is nothing significant about this pattern, the tendency has been twofold; 1) the market will probably not "crash" and 2) expect the market to make one party very happy by reversing its direction after the election.
As always, the table above can't be used to predict what's going to transpire here in 2020, but it can be used to support the idea that there is no discernible edge trading around the election.
Before and after elections sometimes the S&P 500 booms, sometimes the S&P 500 struggles, and sometimes the S&P 500 does very little (1984). There is nothing we can observe today that will definitively tell us what the S&P 500 is going to do from now through November 30th, but there is something that will tell you what you should be doing now through November 30th: your Investment Policy Statement (i.e., your long-term investing plan). Control what you can control, stick to your plan, and we'll all survive this election as we have all of the prior ones.
S&P 500 Primary Trend - Up
Our work continues to label the primary trend for the S&P 500 as up or "bullish".
The index is trading comfortably above all widely followed moving averages, channels, and pivots. Trailing momentum is positive across all time frames except the trailing two months. We're presently higher by 3.59% for the month of October, a nice upside reversal following September's weakness.

During uptrends, long-term investors are best served investing. Uptrends provide a path to capital appreciation, and capital appreciation provides a path for a long-term investor's portfolio to earn the minimum annualized return (MAR) they need in order to fund stated financial objectives. It's imperative long-term investors try to make hay while the sun shines.
Importantly, MAR is different for everyone and influenced most by individual investor attributes. There are a variety of ways to calculate MAR, and once it's calculated a portfolio and strategy can be designed to maximize the probability of achieving your MAR at a given level of volatility. Knowing your MAR also creates a relevant benchmark for measuring portfolio performance, rather than comparing returns to a major market index, which is generally an unequal comparison given meaningful disparity in risk (with risk always being the driving factor of expected returns).
Over the long term, there is no doubt that stocks as an asset class have been most influential in helping long-term investors earn returns that are equal to, or greater than, their personal MAR. This is why prudent portfolio construction and design will almost always begin with an assessment of the investability of the stocks asset class. With interest rates at and around all-time lows, it's virtually impossible for someone to meet their MAR with a meaningful overweight toward the bonds asset class, which invariably forces a meaningful underweight toward the stocks asset class.

With investors "walking up the risk curve", the risk of portfolio drawdown attributed to stocks entering "bear markets" must be managed.
This is why we believe there's no better time than today to diversify how you invest in stocks, not only investing passively but also investing actively. The blending of passive and active approaches toward stock ownership will likely create a synergy that increases the probability of achieving your MAR by smoothing your portfolio's returns.
As Hoffstein would say, "Risk cannot be destroyed, only transformed", and right now most long-term investors have transformed their risk into losing too much money in the event the stocks asset class enters into a prolonged "bear market". This risk must be managed, and we believe adhering to a rules-based, emotionless tactical asset allocation model is the solution.
Lumber Crashes Down To Reality
Lumber prices gained 6.12% this week with Friday's close at $435.40. This ends lumber's six-week losing streak where prices fell -46.47%...not a typo.
Prior to the crash over the last six weeks, lumber prices had gone parabolic, rising from March's low at $282 to August's peak at $766.50 (both in closing prices). Let the price action in lumber be a sign that prices don't move linearly forever. The faster they rise, the harder they fall.

There's no discernible trend for lumber, and we're not sure if there's really any economic value, or signal, in lumber's recent crash. Interestingly, homebuiding stocks, as measured by the SPDR S&P Homebuilding Index (ticker symbol XHB) have snoozed right through lumber's crash. XHB closed higher this week by 0.67% and closed Friday at a new all-time high. Regardless of what's happening in lumber, XHB has been rising.

So, lumber is now the most recent example of the price of an asset trading beyond the limits of imagination. We never imagined it could reach into the mid- ~$700s in August, and we certainly never imagined it would lose half of its value a mere six weeks later. It's part of what we love about following markets; there's always something new and exciting happening.
Happy Sunday!
This material is being provided for client and prospective client informational purposes only. This commentary represents the current market views of the author, and Nerad + Deppe Wealth Management (NDWM, LLC) in general, and there is no guarantee that any forecasts made will come to pass. Due to various risks and uncertainties, actual events, results or performance may differ materially from those reflected or contemplated in any forward-looking statements. Neither the information nor the opinions expressed herein constitutes an offer or solicitation to buy or sell any specific security, or to make any investment decisions. The opinions are based on market conditions as of the date of publication and are subject to change. All data is sourced to stooq.com and stockcharts.com. No obligation is undertaken to update any information, data or material contained herein. Past performance is not indicative of future results. Any specific security or strategy is subject to a unique due diligence process, and not all diligence is executed in the same manner. All investments are subject to a degree of risk, and alternative investments and strategies are subject to a set of unique risks. No level of due diligence mitigates all risk, and does not eliminate market risk, failure, default, or fraud. It should not be assumed that any of the securities transactions or holdings discussed were or will prove to be profitable, or that the investment recommendations or decisions we make in the future will be profitable, or will equal the investment performance of the securities discussed herein. The commentary may utilize index returns, and you cannot invest directly into an index without incurring fees and expenses of investment in a security or other instrument. In addition, performance does not account other factors that would impact actual trading, including but not limited to account fees, custody, and advisory or management fees, as applicable. All of these fees and expenses would reduce the rate of return on investment. The content may include links to third party sites that are not affiliated with NDWM, LLC. While we believe the materials to be reliable, we have not independently verified the accuracy of the contents of the website, and therefore can't attest to the accuracy of any data, statements, or opinions
