The S&P 500 fell -1.03% this week, closing Friday at 6,859.47.
In last week’s Update, we used a football analogy to describe the current price action:
"If you’re like us, you’ve watched a lot of football this weekend. The yellow-highlighted circle on the chart below is analogous to your favorite team putting the ball in the end zone to take the lead. However, the play is under review and it’s difficult to know whether the ball actually crossed the plane."
Well, the price action this week was analogous to your least favorite referee getting on the microphone and announcing:
"Upon further review, the ball didn't cross the plane. The call on the field of a touchdown has been overturned, it's now 2nd down and goal."
And here's the visual evidence to prove it.
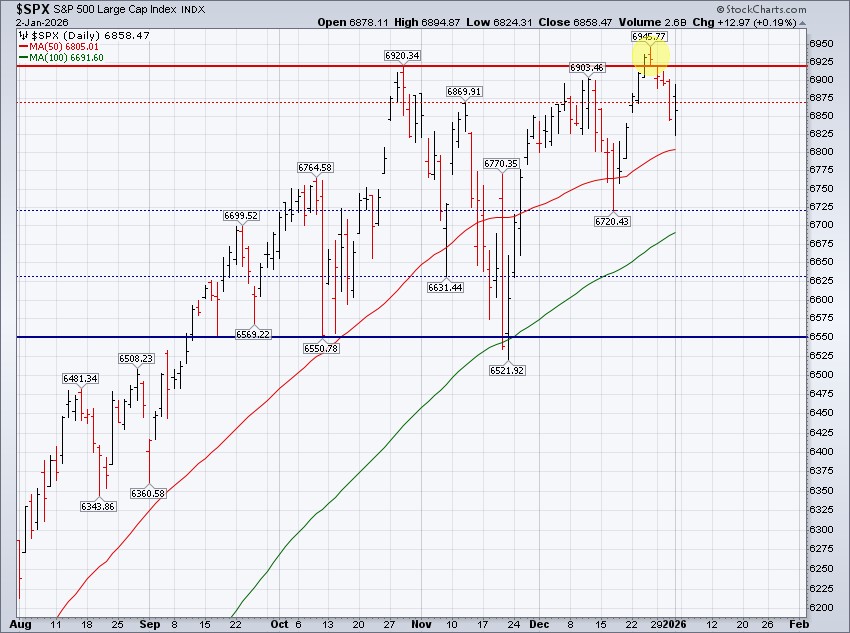
This is the latest example of why we strongly dislike trading ranges.
They are defined and established by repeated failures at or around major levels of support and resistance, exactly what we just witnessed. The S&P 500 traded up to a marginal new all-time high, fueling optimism that the “traffic jam” was a thing of the past, only to make a sharp U-turn lower and leave us stuck in traffic once again.
Friday did manage to kick off 2026 in the green, but the price action did not exactly inspire confidence. The S&P 500 traded as high as 6,894.87 but finished the day well off its highs.
From a technical perspective, we are right back to where we were just a few short weeks ago. Referencing the chart above, major resistance sits near the 6,900 level (thick horizontal red line), with minor resistance just below around 6,870 (dashed red line). On the downside, major support remains near 6,550 (thick horizontal blue line), while minor support can be found around 6,631 and 6,720 (dashed blue lines).
Until the S&P 500 decisively breaks above resistance to new all-time highs or breaks below support to confirm a deeper pullback, the day-to-day price action is likely to remain largely noise.
The market was once again divided this week, with some sectors thriving (energy, utilities and industrials) while others lagged behind (financials, technology and consumer discretionary). Friday’s price action to kick off 2026 reflected continued bifurcation as well. The S&P 500 Equal Weight Index gained 0.68% on Friday, strongly outpacing the S&P 500 itself. International markets surged, with the iShares MSCI EAFE Index (click here) gaining more than 1% and the iShares Emerging Markets MSCI Emerging Markets Index (click here) gaining almost 3%.
We would love for Friday’s price action to prove a precursor of what’s to come in 2026...a calendar year where the market of stocks outpaces the stock market.
A few other areas of note this week:
- Silver fell -8.67% this week with Friday's close at $72.25 an ounce. We wrote about its "day of reckoning" in last week's Update, and this week's downside is probably the start of a normal, healthy correction given the excesses of the last month.
- The bond market continues to snooze. The yield on a 10-year United States Treasury bond closed Friday at 4.20%, or essentially the exact same level as late September or late June. The Fed's cutting, the curve's steepening, but the bond market, collectively, has no interest in moving the intermediate and long end of the yield curve.
As for the week ahead, Trump threw a curveball this weekend with developments in Venezuela.
Tensions around energy policy and broader global instability have the potential to impact oil markets and overall risk sentiment. While equity markets have largely looked past similar developments in recent memory, energy price volatility could reintroduce inflation concerns or influence sector leadership in the near term.
We have a metric ton of fundamental economic data on deck this week, with perhaps none more important than Friday’s jobs report. From a price-action perspective, it will take a move to new all-time highs to get us excited, or a move below approximately 6,720 to get us nervous. Until then, sit back and enjoy the start of 2026.
S&P 500 Primary Trend - Up
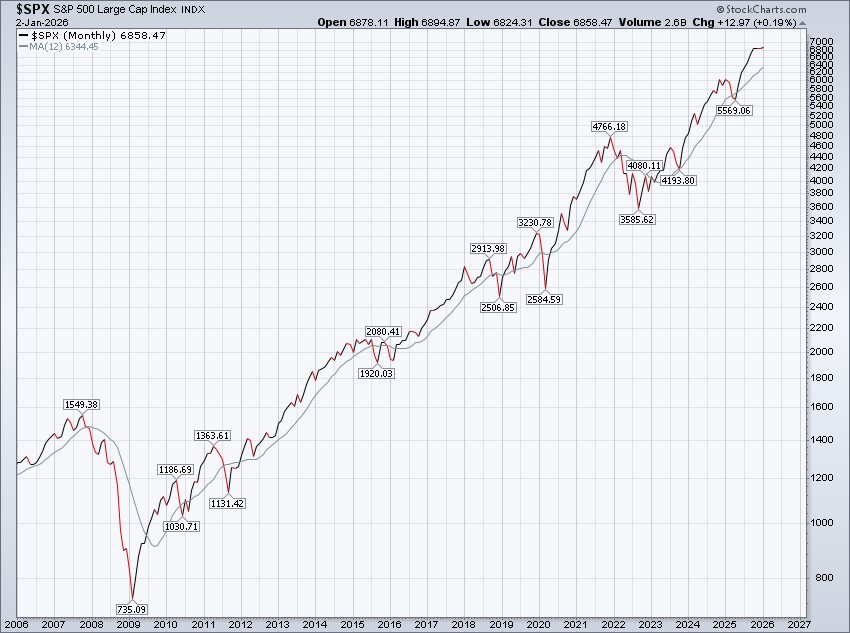
The S&P 500 limped across the finish line in December, closing the month at 6,845.40, a decline of -0.05%. December’s modest pullback ended the S&P 500’s seven-month winning streak and marked the first calendar month since May that the index failed to record a new all-time-high monthly close.
The S&P 500 had been streaking — but it’s no longer streaking — which begs the question: Historically speaking, what happens after the S&P 500’s streak comes to an end?
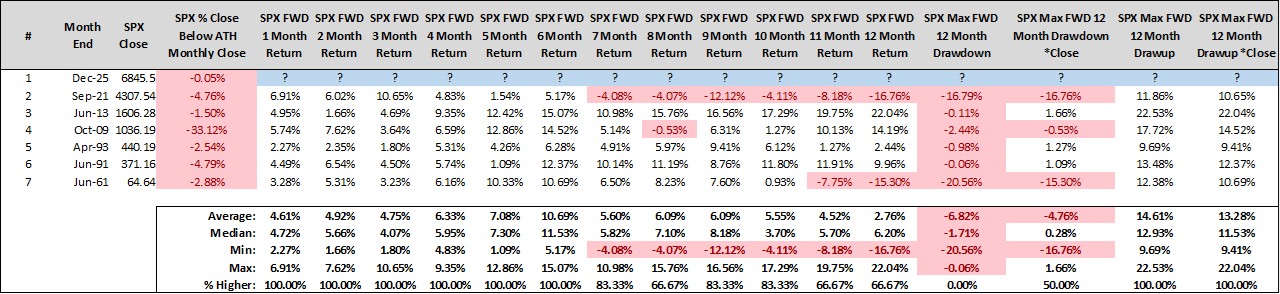
The end of a seven-month winning streak is a nine-month chart pattern, specifically a nine-month sequence of month returns as follows:
- Down
- Up seven months in a row
- Down
Since 1950, there have been just six prior instances of this pattern occurring (with December 2025 marking the seventh). While there is nothing statistically significant to take away from an event that has occurred only six times over more than 70 years, we do find it interesting that, in every prior case, the S&P 500 simply dusted itself off and returned to its winning ways.
Notably, the index has never closed lower over the forward six months in any of those instances.
Hopefully, this time proves to be more of the same.
Even though the S&P 500 limped across the finish line in December, it still delivered another fantastic year.
The index gained 16.39% in 2025 (17.88% including dividends), marking its third consecutive year of double-digit gains. Considering where the S&P 500 stood at April’s year-to-date lows, down more than 17% at the time, the full-year result looks even more impressive.
Our favorite tagline regarding the S&P 500’s price action is: “The S&P 500 trades beyond the limits of imagination.” Few could have imagined what ultimately unfolded in 2025, and there’s a good chance we can’t yet imagine what lies ahead.
Moving forward, we continue to label the primary trend for the S&P 500 as up, or “bullish.” We believe long-term investors are best served by investing as if the best is yet to come, while remaining prepared in the event the worst is actually around the corner.
In practice, this implies that most long-term investors should hold equities as the largest asset class within their allocation, emphasize diversification and strive to sit on their hands until there is clear evidence that something needs fixing, namely the emergence of a primary downtrend in the S&P 500.
So, "diversification" is your friend as we enter into 2026. Stocks are at and around all-time highs, intermediate-term bonds are holding steady with yields offering real returns and gold is clearly in a primary uptrend. There's something for everyone in this day and age, just don't let the fear of striking out keep you from playing the game!
Happy Sunday! Here's to a great 2026!
Steve & Rick