The S&P 500 fell -2.21% this week with Friday's close at 4,357.04.
What a difference a week can make...and not really in a good way this time. Coming off of last week's explosive upside reversal the index traded quietly on Monday, climbing up to 4,457.30. Then came "turnaround Tuesday", again not in a good way.
The S&P 500 declined -2.03% on Tuesday, trading as low as 4,346.33 before closing the session at 4,352.63. At the time, this wasn't all that concerning given the prior week's low at 4,305.91. However, this was now the second week in a row with a -2% daily decline for the S&P 500, so there's clearly an emergence of selling pressure into higher prices across the collective actions of market participants. Selling pressure intensified late Thursday and into Friday morning's trade when the S&P 500 traded down to 4,288.52, slightly below last week's low. At the time, it felt like the index was headed down toward the ~4,200-4,250 region on Friday, but that's where participants stepped up and bought 'em like mad again.
Friday saw the S&P 500 climb nearly 100 points higher after reaching 4,288.52 in the morning, setting a daily high at 4,375.19 in the final hour of trading. Looking at daily closing prices, it's as if nothing happened after Tuesday's decline, but in reality there was obviously a ton that happened. Frankly, we find the last two weeks totally confusing, and since beauty is in the eye of the beholder it's a case of whether the glass is half full or half empty
For the glass-half-full (optimistic) crowd, Friday's upside reversal appears as a fantastic "retest" of last week's lows and a successful retest of the 100-day simple moving average (100MA).
Once upon a time, stocks didn't always bottom in a "V"-like manner. Instead, they tended to bottom in a "W"-like manner, where pivotal lows were "retested" before prices resumed their upward ascent. Any move back toward ~4,450 this week will leave a "W" on the chart.

For the glass-half-empty crowd, we can zoom in and add a few elements to the above chart that turn the picture a bit ominous.
For example, we now have a lower high on the chart, which brings about the emergence of a downtrend line (negatively sloping red arrow). This week's downside reversal also now leaves "resistance" via the 50-day simple moving average, which was rock-solid support throughout all of 2021. Tuesday's plunge lower also coincided with a 61.8% Fibonacci retracement, or the point at which the S&P 500 had recovered 61.8% of the selloff from ~4,545 down to ~4,305. The 61.8% Fibonacci retracement was at ~4,454, and this week's high was ~4,457. Coincidence? Maybe, maybe not.

Looking under the market's hood this week, the "re-opening trade" was on center stage leading the charge to the upside.
For the week, energy gained 5.78%, the financials only declined -0.18%, and materials only lost -0.86%. All three sectors decidedly outpaced the return of the S&P 500. Meanwhile, the technology sector declined -3.28%.
The issue here lies in the fact that the technology sector accounts for ~28% of the S&P 500, and energy, financials and materials combine for just 17% of the index. In the event the "re-opening trade" does take the ball and run, and the technology sector doesn't hang in there, it's difficult to envision the S&P 500 setting new highs. It's like the Lakers' title chances if everyone but Lebron James is on fire; there's no chance a title's coming home to Los Angeles. The Lebron James of the market (the technology sector) can't suddenly become the weakest link if we expect the uptrend to extend materially higher.
S&P 500 Primary Trend - Up
The S&P 500 put the month of September in the books on Thursday, declining -4.76%.
September's decline ends the S&P 500's monthly winning streak at 7 months and records our first monthly decline since January of 2021. We often write that prices don't move linearly forever, and while it's by no means a bold statement, September's monthly decline proves it.
So, the question now is whether the S&P 500 can dust itself off, pick itself up off the floor, and get back to its winning ways. From a narrative perspective, September recorded as a "bearish outside reversal month", or a calendar month with a higher high, lower low, and lower close than the month prior. Further, September's price action reads like a distribution month. That is, the S&P 500 set a new all-time high in September but went on to finish the month down by nearly -5%.
Naturally, this made us curious about how the S&P 500 has traded following calendar months that establish new all-time highs during the month, but ultimately find selling pressure and finish the month down -3% or more. Subjectively, it sounds like this should be a bad omen about what comes next, a sign of distribution into all-time highs for the S&P 500. But what does history have to say?
Since 1950 we have 20 calendar months that match, and all you have to do is glance at the table to know this type of monthly reversal hasn't been a bad omen at all (i.e., notice how overwhelmingly white the table is in the return columns). If anything, reversal months of this nature have been a fantastic sign regarding what lies ahead. Go figure.
In the prior 20 instances, the S&P 500's forward 3-, 4-, and 5-month returns have closed higher 14 times in a row, dating all the way back to 1986, and 18 out of 20 overall with both losers occurring prior to 1970.

Our work continues to label the primary trend as up or "bullish". Broadly speaking, we believe most long-term investors are best served with an equity overweight across their portfolios' asset allocation and relying mostly on passive investing methodologies.
It isn't until the primary trend can be labeled as down, or "bearish", where long-term investors should consider drastic portfolio rebalancing in order to be safe rather than sorry. A -5% pullback after setting new all-time highs for each of the last 11 calendar months certainly isn't enough selling pressure for long-term investors to be overly concerned about.
We're all mostly aware that a decline of -10% from peak to trough for the S&P 500 is the standard definition of a "correction", and we're all generally aware that we should expect this to occur each and every year of our investing lives. So, perhaps we're experiencing our standard annual "correction", or paying the price of admission as Charlie Bilello would say (click here).
Since "corrections" are temporary, and only interrupt primary uptrends, long-term investors can best manage them by sitting on their hands. At the moment, that's what we believe is the best course of action for long-term investors: to be tolerable to the S&P 500's volatility in exchange for capturing the index's returns over the remainder of 2021. And if history is any guide here, we have a strong fourth quarter in front of us.
The great Wayne Whaley (click here) shared the S&P 500's performance over the fourth quarter of all calendar years where the S&P 500 both set a new all-time high in the month of September and closed the month of September in the red. The index is then undefeated over the fourth quarter for average returns of 5.07%.

While the past alone can't be used to consistently predict the future, it can help us stay in the game when things get a bit dicey. That's why we don't jump out of airplanes when we experience turbulence, and it's why we shouldn't jump off our long-term investing plans when we're paying a small price of admission.
Bitcoin Booming, Interest Rates Curiously Flat, Breadth Bottom?
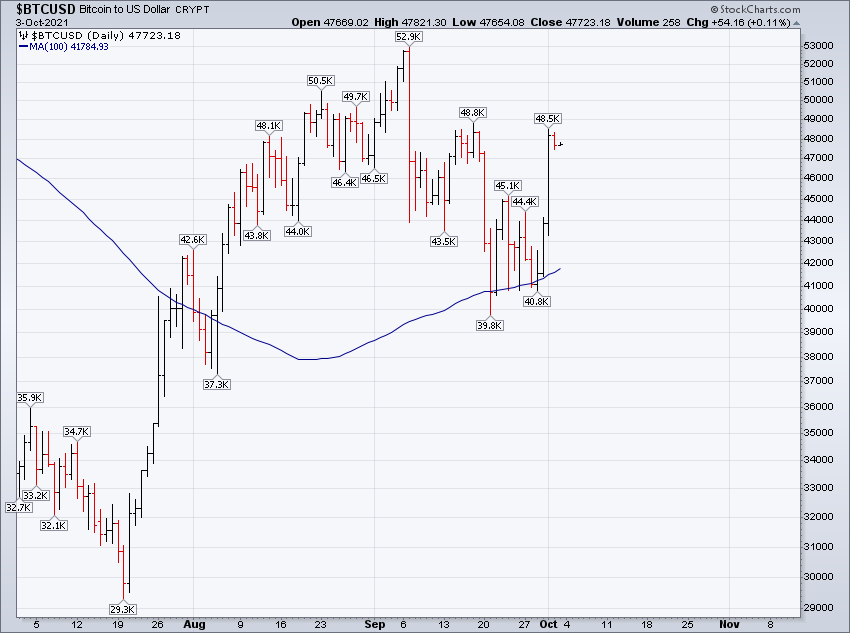
Bitcoin Booming
Bitcoin's back to booming. "Digital gold" is doing its best impression of the S&P 500 by using the 100-day simple moving average (solid blue line) like a trampoline back to the upside.
Interest Rates Flat
Given the surge in the "re-opening trade", one would assume there was a nice move higher across the yield curve. But that wasn't really the case this week. The yields on 10- and 30-year United States Treasury bonds were basically unchanged on the week.

Breadth Bottom?

Happy Sunday!
Steve & RickThis material is being provided for client and prospective client informational purposes only. This commentary represents the current market views of the author, and Nerad + Deppe Wealth Management (NDWM, LLC) in general, and there is no guarantee that any forecasts made will come to pass. Due to various risks and uncertainties, actual events, results or performance may differ materially from those reflected or contemplated in any forward-looking statements. Neither the information nor the opinions expressed herein constitutes an offer or solicitation to buy or sell any specific security, or to make any investment decisions. The opinions are based on market conditions as of the date of publication and are subject to change. All data is sourced to stooq.com and stockcharts.com. No obligation is undertaken to update any information, data or material contained herein. Past performance is not indicative of future results. Any specific security or strategy is subject to a unique due diligence process, and not all diligence is executed in the same manner. All investments are subject to a degree of risk, and alternative investments and strategies are subject to a set of unique risks. No level of due diligence mitigates all risk, and does not eliminate market risk, failure, default, or fraud. It should not be assumed that any of the securities transactions or holdings discussed were or will prove to be profitable, or that the investment recommendations or decisions we make in the future will be profitable, or will equal the investment performance of the securities discussed herein. The commentary may utilize index returns, and you cannot invest directly into an index without incurring fees and expenses of investment in a security or other instrument. In addition, performance does not account other factors that would impact actual trading, including but not limited to account fees, custody, and advisory or management fees, as applicable. All of these fees and expenses would reduce the rate of return on investment. The content may include links to third party sites that are not affiliated with NDWM, LLC. While we believe the materials to be reliable, we have not independently verified the accuracy of the contents of the website, and therefore can't attest to the accuracy of any data, statements, or opinions.
