The S&P 500 declined -0.43% this week with Friday's close at 4,155.86.
The index has now declined two weeks in a row and has closed red seven of the last ten trading days. However, recent selling pressure has been mostly contained as the S&P 500 has declined just -1.81% over the last ten trading days. It's like being pinched, rather than being punched, fortunately.
The price action this week wasn't nearly as volatile as the week prior, but the overall structure of this week's trading was like a case of deja vu. Each of the last two weeks have now closed red Monday through Wednesday, found their weekly low on Wednesday, and then managed to close Friday more than 2% higher than Wednesday's weekly low. Both weeks have felt like the world was ending on Wednesday and everything was fine on Friday.
In last week's Update we noted that market technicians had horizontal lines drawn between 4,238.04 and 4,056.88 and that any and all price action confined between these two levels was noise. Ironically, the price action this week was all noise. Loud noise, but all noise nonetheless.
The S&P 500 traded down to 4,061.41 at Wednesday's low, less than five points above the prior Wednesday's low, and if felt like we were hanging on by a thread. At the time, we believed the S&P 500 would go on to trade down into the high 3900s, but clearly the S&P 500 had other ideas. Somehow, someway the S&P 500 fought off the ropes again. All in all, this week did record as an "inside week", or a calendar week with a higher low and lower high than the week prior. We'll call the price action this week a stalemate.

From a sector perspective, the Nasdaq Composite (COMPQ) was able to get off the schneid this week, but not by much.
COMPQ gained 0.31% this week, bringing an end to its 4-week losing streak, but it sort of limped across the line. With the technology sector accounting for roughly 25% of the value of the S&P 500, it's rather imperative COMPQ finds its footing.
Quantitatively, there is some optimism here for COMPQ.
Since the year 2000, there are 30 prior four-week losing streaks that failed to make it to a five-week losing streak. Interestingly, COMPQ has then closed the very next week higher 12 instances in a row and 15 of the last 17 times, almost all of which are concentrated in the post- great financial crisis era. Nine out of the last fourteen times this five-week pattern has occurred COMPQ was onward and upward from there, meaning COMPQ didn't close a calendar week lower over the forward one month. COMPQ leading over the coming month would mark the epitome of mean reversion.

Collectively, the re-opening trade struggled a bit this week.
The energy sector was the worst performing sector on the week, falling by -2.49%. The financials, materials, and industrials all closed lower for the week too. The traditional market capitalization- weighted S&P 500 (SPX) outpaced the equal-weighted S&P 500 (SPXEW) by 0.25%, ending a four-week losing streak to SPXEW.
Broadly speaking, there's still plenty of room to run for SPXEW, which we view as a component on the re-opening side of the barbell.

For the week ahead, all eyes remain glued to ~4,238 and ~4,056. Consecutive inside weeks aren't the norm, so there's a good chance we trade above ~4,188 or below ~4,061 this week. If we do trade above ~4,188, perhaps we'll take a sprint at retesting the ~4,238 region. The month of May has brought consolidation, congestion, volatility and frustration, but finishing the month above 4,181.17 would bring us our fourth consecutive positive monthly close. Given everything that's transpired this month, that would be some sign of resilience.
S&P 500 Primary Trend - Up
We've got five trading days remaining in the month of May and the S&P 500 is presently lower by -0.61% for the month.
The index came into the month riding a three-month winning streak, and having gained a whopping 12.57% the last three months, so May's consolidation, congestion, volatility and frustration is beyond normal.
Our work continues to label the primary trend for the S&P 500 as up or "bullish".

It's fair for us to question why stocks are in demand, even if the answer to that question is truly unknowable. Our favorite narrative here is "TINA", an acronym for the phrase "there is no alternative". Put simply, stocks are the cleanest shirt in a basket of dirty laundry...really, really dirty laundry.
We'd argue that the bond/fixed income asset class is currently more unattractive as an investment than at any point over the past 40 years. The yield on a 10-year Treasury bond is presently 1.63% with inflation running at ~4% and the Federal Reserve openly stating they want inflation to run above trend for an extended period of time. Real yields are currently at -2.5%, and going lower if the Fed has their way. That's just a fancy way of saying the bond/fixed income asset class is probably screwed going forward, for lack of a better word.
Now, there are definitely tactical shifts long-term investors can make in the bond/fixed income asset class to not be screwed, but the days of passively owning a broad bond index and expecting to generate real return are behind us.
We absolutely believe this plays a role in distorting asset allocation decisions and helping fuel a perpetual bid underneath stocks when volatility strikes. Think of it this way: if stocks are incredibly more attractive than bonds with the S&P 500 trading a stone's throw away from all-time highs, how much more attractive will they be when they go on sale by -10% or -20%?
This is partly why we don't believe a "bear market" for the S&P 500 is close. This is not to say the S&P 500 won't experience a violent correction in the not too distant future. A sharp, fast, violent -10%-20% downturn is the norm for modern markets and it's always in the deck of cards. But a sustained multi-year downturn is difficult to envision when there is no alternative to invest in. Capital has to flow somewhere, and for stocks to experience a multi-year downturn participants have to allocate capital toward something else for multiple years. Historically, that's always been cash and/or bonds/fixed income. In this day and age, that playbook is gone until interest rates normalize. This is why we often write about the need for there to be a "bear market" in bonds first before a "bear market" in stocks will unfold (we do recognize there's a chance they happen in parallel).
In the interim, our favorite way to show you a picture of TINA is to plot a chart that divides the yield on a 10-year United States Treasury bond by the dividend yield on the S&P 500. The ratio presently sits slightly above parity on a nominal basis. In real terms, the ratio is at all-time lows. Notice also how the ratio has been completely distorted since the great financial crisis. That's the Federal Reserve in action.

Crypto Crashing, Gold Booming, Yields Consolidate
The cryptocurrency market crashed this week. In last week's Update we painted two pictures for Bitcoin. For the glass half empty crowd we wrote:
"For the half empty crowd, Bitcoin is forming a top and appears ready to trade down into the $20,000-$30,000 range."
We didn't know the glass was half empty, but with the luxury of hindsight the glass was absolutely half empty as Bitcoin traded down to exactly $30,000 this week.

As "digital gold" falters, actual gold is booming.
The shiny yellow metal has now increased three weeks in a row. Gold has been a terrible hedge against inflation over the long term, but that misses the point in our opinion. Gold has been a great hedge against inflation when the inflation is actually unfolding. Perhaps real yields at -2.5% are finally starting to give gold a tailwind.

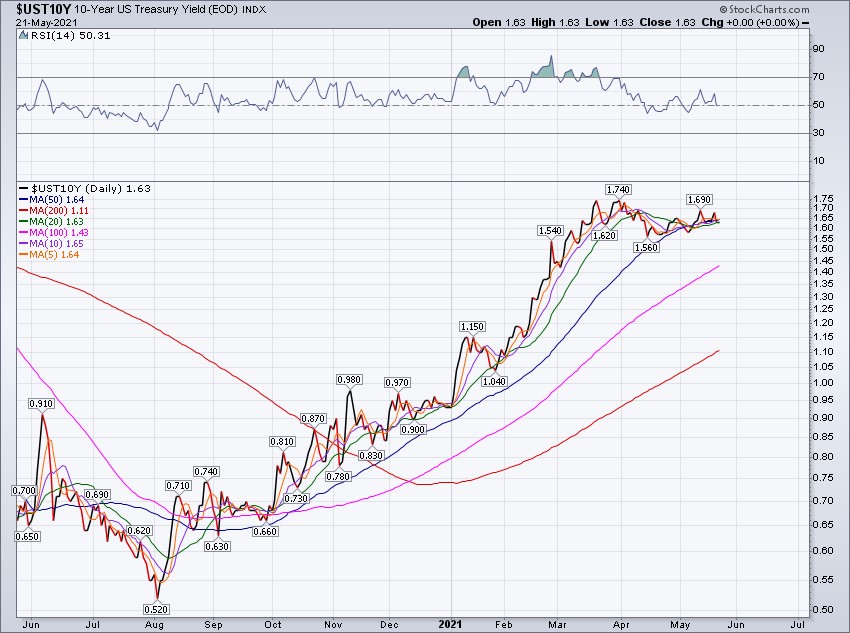
Helping gold's recent rally is the fact that interest rates stopped going up.
The yield on a 10-year United States Treasury bond (UST10y) closed Friday at 1.63%. UST10y has gone absolutely nowhere for two months. UST10y first reached 1.63% on March 12th. Given how UST10y was absolutely roaring to the upside, two months of consolidation is absolutely normal.
Happy Sunday!
Steve & RickThis material is being provided for client and prospective client informational purposes only. This commentary represents the current market views of the author, and Nerad + Deppe Wealth Management (NDWM, LLC) in general, and there is no guarantee that any forecasts made will come to pass. Due to various risks and uncertainties, actual events, results or performance may differ materially from those reflected or contemplated in any forward-looking statements. Neither the information nor the opinions expressed herein constitutes an offer or solicitation to buy or sell any specific security, or to make any investment decisions. The opinions are based on market conditions as of the date of publication and are subject to change. All data is sourced to stooq.com and stockcharts.com. No obligation is undertaken to update any information, data or material contained herein. Past performance is not indicative of future results. Any specific security or strategy is subject to a unique due diligence process, and not all diligence is executed in the same manner. All investments are subject to a degree of risk, and alternative investments and strategies are subject to a set of unique risks. No level of due diligence mitigates all risk, and does not eliminate market risk, failure, default, or fraud. It should not be assumed that any of the securities transactions or holdings discussed were or will prove to be profitable, or that the investment recommendations or decisions we make in the future will be profitable, or will equal the investment performance of the securities discussed herein. The commentary may utilize index returns, and you cannot invest directly into an index without incurring fees and expenses of investment in a security or other instrument. In addition, performance does not account other factors that would impact actual trading, including but not limited to account fees, custody, and advisory or management fees, as applicable. All of these fees and expenses would reduce the rate of return on investment. The content may include links to third party sites that are not affiliated with NDWM, LLC. While we believe the materials to be reliable, we have not independently verified the accuracy of the contents of the website, and therefore can't attest to the accuracy of any data, statements, or opinions.
