The S&P 500 declined -0.64% this week with Friday's close at 3,319.47.
The index has now declined three weeks in a row for the first time in 2020 (and the first time since October of 2019). The S&P 500 has lost -5.37% over its three-week losing streak, solidifying the fact that stocks don't only go up.
The price action this week was a carbon copy of each of the last two weeks. Since we turned the calendar month to September, the script has been for strength to start the week and weakness to finish the week.
In last week's Update we noted that the market had defined "clear resistance at the ~3,425 price region." We saw that again this week as the S&P 500 traded up to 3,428.92 on Wednesday, a smidge above the ~3,425 price region, and then collapsed again into Friday's close.
There remains a "boogeyman" living at the ~3,425 price region (red arrows below). Nothing good can happen until the S&P 500 breaks, and sustains, above ~3,425.

Like last week, the market did just enough to leave the forecast cloudy, or uncertain, for the week ahead. At Friday's low, the S&P 500 could have very easily sustained below last week's low at 3,310.47. That would have left the narrative fairly negative and put a bullseye at the ~3,200 price level. However, the index found some buying interest and finished Friday's session back above last week's low at 3,310.47.
Referencing the chart above, this week's price action mostly perpetuates a trading range between ~3,300 and ~3,425 - it doesn't solidify which way the range will break. Should Monday not record as an "inside day" (meaning we see the S&P 500 either trade below 3,292.40 or above 3,362.27), that will provide clues about whether the bulls regained control of the ball into Friday's close.
Looking at the week ahead, there are two interesting quantitative viewpoints. First, when viewing next week in isolation we can observe that, seasonally speaking, it's a negative time period for the S&P 500. The great Wayne Whaley called next week (defined as the S&P 500's price action from 9/16 through 9/26) the "weakest week of the weakest month". Over the last 30 years, the S&P 500 has closed this period negative 24 of 30 times for average declines of -1.07%.
In isolation, it would appear the S&P 500 has a headwind directly in front of it.

However, we're also riding a three-week losing streak, and the phrase "prices don't move linearly forever" applies to both upward and downward price action. If we call out all prior three-week losing streaks that both began with the S&P 500 within -5% of its all-time high weekly close, and then declined between -4% and 8% in total, we're left with 19 prior instances the last 40 years (this week's close marks number 21). Of those prior 19 instances, the S&P 500 is mostly higher one month later, rising 15 of 19 for average returns of 2.48%.
But, the forward one week has seen the index close lower 4 of the last 5 times, and 5 of the last 7, for average declines of -2.09% and -1.41% respectively.
On average, the forward one-month range records between -4% on the downside and +5% on the upside, suggesting the S&P 500 trades between ~3,186 and ~3,484 from Monday's open through October 16th.

The sequence of what come first - the drawup toward ~3,484 or the drawdown toward ~3,186 - is obviously the most difficult part to forecast. Putting the studies together would suggest we plan for weakness the remainder of September, and then strength the front half of October.
We'd welcome this scenario as it remains ideal for the S&P 500 to bend, but not break.
The most durable of returns tend to follow deeply "oversold" conditions, and in the event we arrive at ~3,186 sooner rather than later we'd be deeply "oversold" (and testing our 100-day simple moving average, yellow box on the chart below).

Finally, we'd be remiss in not pointing out that the price action in 2020 has mostly gone against the grain thus far. It would be par for 2020's course for the S&P 500 to have bottomed on the Friday just prior to the weakest week of the weakest month of the year.
So, hopefully the week ahead can do what each of the past three weeks have failed to do...finish on a positive note (regardless of whether we start off the week strong or weak!).
S&P 500 Primary Trend - Up
Our work continues to label the primary trend for the S&P 500 as up or "bullish".
During uptrends, long-term investors are best served with an equity overweight across their portfolios' asset allocation and relying mostly on passive investing methodologies. Generally speaking, the biggest risk long-term investors face during primary uptrends is that of opportunity loss, and not that of portfolio drawdown. It's the root of the phrase "the trend is your friend" and the trend for the S&P 500 at the moment remains up, even with the index down -5.17% thus far in September.

In general, the best psychological stance to take when investing for the long term is to position your portfolio as if the best is yet to come, while also being prepared to manage risk in the event the worst is just around the corner. This phrase perfectly articulates the predicament for both stocks and the economy at the present moment.
The future remains best described as "radically uncertain", meaning it shouldn't come as any surprise if the S&P 500 absolutely skyrockets higher, or totally collapses, over the forward one year.
There's a compelling, articulate, and convincing case to be made for both scenarios. In other words, there's meaningful risk to investing in stocks (stocks collapse the next year), and there's meaningful risk not investing in stocks (stocks skyrocket the next year). This is why we believe long-term investors should have a tactical approach with their asset allocation, forward-looking. They'll at least be giving themselves a chance to win in both scenarios.
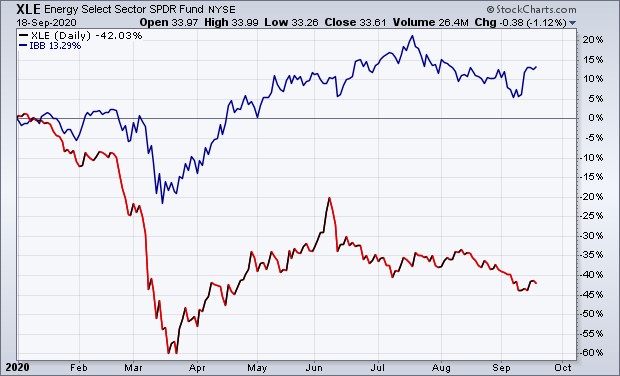
From a perspective of which stocks to own, this week saw the biotechnology sector, as measured by the iShares Nasdaq Biotechnology ETF (ticker symbol IBB) absolutely roar back to life. IBB gained 6.68% this week, a week where the S&P 500 declined. Yeah, that's never happened before. Interestingly, the last time we saw something even remotely similar was from December of 2008 when IBB gained 4.65% for the week with the S&P 500 declining -0.10% for the week.
Nonetheless, IBB's price action this week supports the outperformance long-term investors can find by focusing on specific sectors of the market that are demonstrating the most relative strength.
The bifurcation between what's working, and what isn't, across the investable universe has perhaps never been greater. IBB is higher by 13.29% thus far in 2020, while the energy sector, as measured by the SPDR Energy Select Sector Index (ticker symbol XLE) is down by -42.03% thus far in 2020. The disparity in returns from those who overweighted IBB, against those who overweighted XLE, is gigantic.
Moving forward, we expect this sort of bifurcation to continue. We're obviously not certain as to what sectors will be the big winners or big losers into the future, but a systematic, mechanical approach to security selection can help identify those areas showing the most relative strength. And the areas showing the most relative strength today are the areas most likely to show relative strength tomorrow.
Fed Speak - What It Means For Bonds & Gold
We heard from Federal Reserve Chairman Jerome Powell this week (click here). Powell's press conference was perfectly correlated to the S&P 500's peak on Wednesday, so if correlation was to imply causation then it's clear market participants didn't like what he had to say on Wednesday.
The Federal Reserve's statement didn't have much new information in it, at least not in our opinion. They continue to strive to "inflate or die", that is:
"...the Committee will aim to achieve inflation moderately above 2 percent for some time so that inflation averages 2 percent over time and longer-term inflation expectations remain well anchored at 2 percent."
Perhaps the market's gripe with the Fed's language is that they haven't told us how they're going to achieve inflation moderately above 2% for some time.
We all understand interest rates aren't going anywhere with the Federal Reserve telegraphing that the federal funds rate will remain anchored to the 0% level for years to come.
We all understand that we're in an environment of "QE forever", where there is no end date in sight to the Federal Reserve's expansion of its balance sheet.
What we're not all aware of is how the Fed is going to goose inflation since they haven't been able to do so at any point over the past decade, based on the strict definition of inflation. They've perhaps been successful at inflating asset prices, which isn't exactly in their mandate and has perhaps contributed to the bifurcation across the economy via the weakening of the middle class, in terms of social mobility. Regardless, the Fed's made their goal clear, they just haven't made it clear how they're going to achieve this goal. Ironically, it might be the responsibility of fiscal policy to get this job done. Modern Monetary Theory, here we come?
Looking at the price action in gold and long-term Treasury bonds this week, gold gained 0.73% with Friday's close at $1,962.10 and long-term Treasury bonds declined -0.33%. Gold remains coiled, or poised for an expansion in volatility, as we look forward. A breakout in either direction is certainly in the deck of cards for the week ahead.

Similar to gold, long-term Treasury bonds (USB) have been stuck in a narrow trading range since an upward explosion in the first quarter. USB presently yields just 1.45%, so it's quite clear there aren't any inflation expectations yet built into the price of USB.

And therein lies the Fed's dilemma. Inflation expectations finding their way into USB will suggest much higher interest rates, a steepening of the yield curve. However, this acts like a brake on economic conditions, which then creates a negative feedback loop of falling inflation expectations.
In our opinion, the Fed's going to be forced to incorporate yield curve controls, or effectively buy USB like mad through open market operations in order to keep the curve accommodative while allowing inflation to run hot.
This is the epitome of negative real interest rates, which is a backdrop where gold tends to shine the brightest. It's also somewhat of a free pass for USB, as it's difficult to see how USB will be allowed to decline in price when the Fed's objective is for USB to sustain its price. We have to believe the Fed is fully aware of the risks associated with losing control of the yield curve, and they're disastrous.
Moving forward, we continue to believe the antidote to radical uncertainty (which are also the best words to best describe future monetary and fiscal policy) is prudent diversification. Implementing a portfolio that's diversified at the asset class level, the security selection level (emphasizing areas showing relative strength), and the strategy level (diversifying how you invest in stocks and/or bonds, passively and actively) will serve to smooth returns into the future.
Prudent diversification won't hit any home runs, but it won't leave you striking out either. You, and your financial plan, will live to fight another day, and if we want to enjoy the sunny days that are in our future in a world post-COVID, we have to survive the cloudy skies of the present as we still face the effects of COVID. Prudent diversification is our survival guide.
Happy Sunday!
This material is being provided for client and prospective client informational purposes only. This commentary represents the current market views of the author, and Nerad + Deppe Wealth Management (NDWM, LLC) in general, and there is no guarantee that any forecasts made will come to pass. Due to various risks and uncertainties, actual events, results or performance may differ materially from those reflected or contemplated in any forward-looking statements. Neither the information nor the opinions expressed herein constitutes an offer or solicitation to buy or sell any specific security, or to make any investment decisions. The opinions are based on market conditions as of the date of publication and are subject to change. All data is sourced to stooq.com and stockcharts.com. No obligation is undertaken to update any information, data or material contained herein. Past performance is not indicative of future results. Any specific security or strategy is subject to a unique due diligence process, and not all diligence is executed in the same manner. All investments are subject to a degree of risk, and alternative investments and strategies are subject to a set of unique risks. No level of due diligence mitigates all risk, and does not eliminate market risk, failure, default, or fraud. It should not be assumed that any of the securities transactions or holdings discussed were or will prove to be profitable, or that the investment recommendations or decisions we make in the future will be profitable, or will equal the investment performance of the securities discussed herein. The commentary may utilize index returns, and you cannot invest directly into an index without incurring fees and expenses of investment in a security or other instrument. In addition, performance does not account other factors that would impact actual trading, including but not limited to account fees, custody, and advisory or management fees, as applicable. All of these fees and expenses would reduce the rate of return on investment. The content may include links to third party sites that are not affiliated with NDWM, LLC. While we believe the materials to be reliable, we have not independently verified the accuracy of the contents of the website, and therefore can't attest to the accuracy of any data, statements, or opinions.
