The S&P 500 fell -2.45% this week with Friday's close at 3,811.15.
The index has now declined two weeks in a row for the first time since October of last year. We've often written how modern markets seem to trade as if there's an on/off switch, and the latest example is the index seemingly turning off on Friday, February 12th. After closing February 12th at a new all-time high daily close at 3,934.83, the S&P 500 has closed higher just two of the last nine trading days while declining -3.14% over that time span.
Ironically, things were feeling good on Wednesday. The S&P 500 traded as high as 3,928.65, a stone's throw away from our all-time high daily close, and closed Wednesday's session at 3,925.43, the fourth highest daily close in the history of the index. But resistance ultimately revealed itself yet again.
The S&P 500 traded down to its weekly low at 3,789.54 on Friday, marking a decline of -3.54% in a little more than one trading day. Friday attempted to rally nicely off the ~3,789.54 level, climbing as high as 3,861.08 just hours later, only to then stumble into Friday's close. Speaking of stumbling into the close, the month of February couldn't do anything differently than the month of January. For the second consecutive calendar month, we stumbled across the finish line (click here).
Where do things head from here? Well, the collective actions of market participants has an uncanny ability to maximize uncertainty, and right now we have no idea if the next 100 points for the S&P 500 are higher or lower. It feels like they're guaranteed to be lower, meaning we're destined to reach ~3,711 before ~3,911, but feelings are generally wrong (see feeling good on Wednesday).
Resistance has firmly planted itself in the ~3,930-3,950 region while support sits in the ~3,780-3,800 region, a confluence of support via the 50-day simple moving average and the 61.8% Fibonacci retracement when connecting January's low (3,694.7) to February's high (3,950.43). Until the price of the S&P 500 breaks and sustains "outside" of support or resistance everything is just noise. Loud noises, but noise nonetheless.

We never heard from President Biden this week, so the upside catalyst we discussed last week never materialized. Ironically, we will hear from Jerome Powell this week at the Wall Street Journal Jobs Summit on Thursday (click here). Given the year-to-date cratering in the bond market, it's a perfect time for some Fed jawboning.
The major narrative this week was indeed the rise in interest rates across the yield curve.
The 10-year United States Treasury bond (UST10y) traded up to 1.54%, the highest level since almost exactly one year ago. The 30-year United States Treasury bond (UST30y) climbed to 2.33%, its highest level since January of 2020.
It's almost laughable to think 1.54% on UST10y and 2.33% on UST30y are enough to spook equity market participants, but the rate of change, or speed and linearity in which yields are rising is likely influencing the S&P 500's jitters. The price of UST30y has declined five weeks in a row, so it's been a one-way ticket to the upside for yields. This exacerbated the bifurcation in the performance of the sectors within the S&P 500 this week, furthering our conviction about the need for investors to have a "diversified, barbell-like approach toward equity allocations".
Look no further than the fact that the S&P 500 technology sector fell -3.95% this week while the S&P 500 energy sector gained 4.33%!
As we wrote last week, while the technology sector has carried the load for a long, long time, that's not going to be the case in the event where we truly have an economic bonanza on our hands, and bonds are pricing as if the economic bonanza is real.
S&P 500 Primary Trend - Up
Lost in the shuffle of stumbling across the finish line is the fact that the S&P 500 won the month of February.
The index gained 2.61% for the month and closed the month at a new all-time high monthly close. February was different than January in this regard as we at least managed to hang on to some of our gains.
At its peak, the month of February was higher by 6.36%, so this is why finishing the month higher by just 2.61% feels like a letdown. Since 1970, there are twenty other calendar months that traded up by 5% or more at some point during the month, only to then leave investors feeling letdown by closing the month by less than 3% We'll title them "letdown months".
Ironically, we can file "letdown months" as something that's historically all bark and no bite.
There hasn't been anything overly "bearish", forward-looking, following calendar months that exhibited similar price action to what we saw in February. In fact, feeling letdown by "letdown months" is usually temporary and the S&P 500 gets right back to its winning ways. Three months after these twenty prior "letdown months" the S&P 500 closed higher sixteen of twenty times (80%) for average returns of +4.10%.

We also have the historical tailwind of the month of February closing at a new all-time high monthly close.
February of 2021 becomes the 17th February to close at a new all-time high since 1970. The prior sixteen saw the S&P 500 continue to climb, with the index closing higher three months later fifteen of sixteen times and both the remainder of the calendar year and one year later fourteen of sixteen times. Average returns are stellar across the board.

So, while both January and February were disappointing, the preponderance of evidence suggests the primary trend for the S&P 500 remains up, or "bullish". During uptrends, long-term investors are best served investing in the most traditional sense of the word; uptrends are a time to buy 'em and hold 'em. It's not until the primary trend can be labeled as down, or "bearish", that long-term investors should strive to win by not losing. We're clearly not there yet, so for now we all have to dance while the music is playing.

Financials Breakout, Small Caps Rise Again, Energy Roars, Crypto Cools Off
The S&P 500 Financial Index (SPF) finally broke out to the upside this week with Friday's close at 535.64.
Friday's close is a new all-time high monthly close for SPF. SPF gained a massive 11.36% in February, strongly outpacing the S&P 500 by 8.53%. SPF hasn't outpaced the S&P 500 by more than 8% in a single calendar month since November of 2016 and before that August of 2009. Safe to say the outperformance in February was rare.
The monthly chart of SPF is easily our favorite chart pattern. It's analogous to the feeling you get when you find the left lane free and clear after you've been stuck sitting in traffic for longer than you ever imagined. You just want to slam on the gas and go. SPF now has no known resistance left on the charts, and there's a chance it slams on the gas and goes. It's going to be popular to believe the fate of SPF lies entirely in the yield curve's hands, but we'd caution against having conviction in the idea that one variable controls the fate of the entire financial sector.

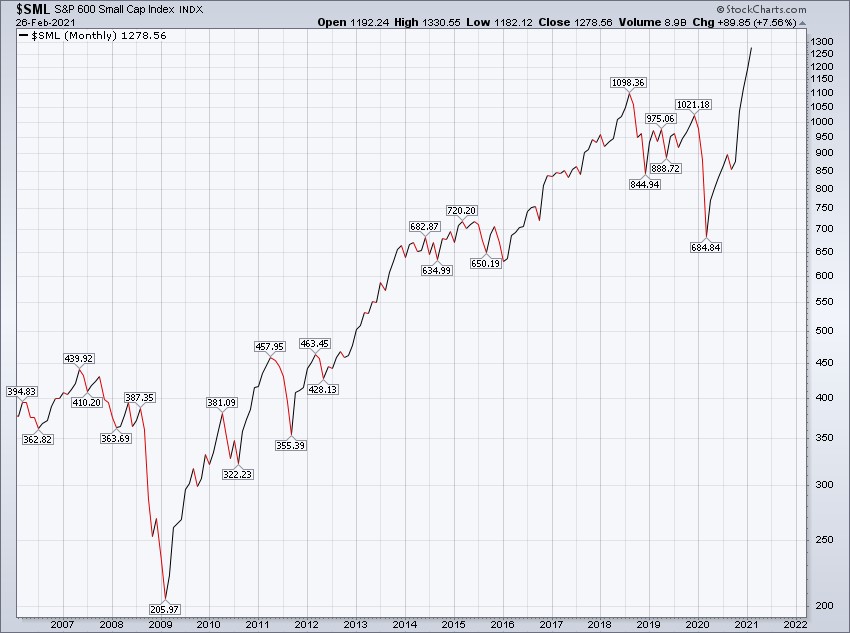
Small-cap stocks, as measured by the S&P 600 Small Cap Index (SML), gained 7.56% for the month of February.
SML has increased five months in a row, and ten of the last eleven months, while closing February at a new all-time high monthly close. SML's trailing five-month return records at an astounding 49.49%, the strongest five- month period of returns in the index's history.
The only narrative here to describe SML's absurd performance in the present is the idea of an economic bonanza into the future.
The S&P 500 Energy Sector (SPEN) absolutely roared in February too, rising by 21.47%.
SPEN has gained 20% or more in over a single calendar month three times in its history, and all three happened to be in the last twelve months (Feb 2021, Nov 2020, Apr 2020).

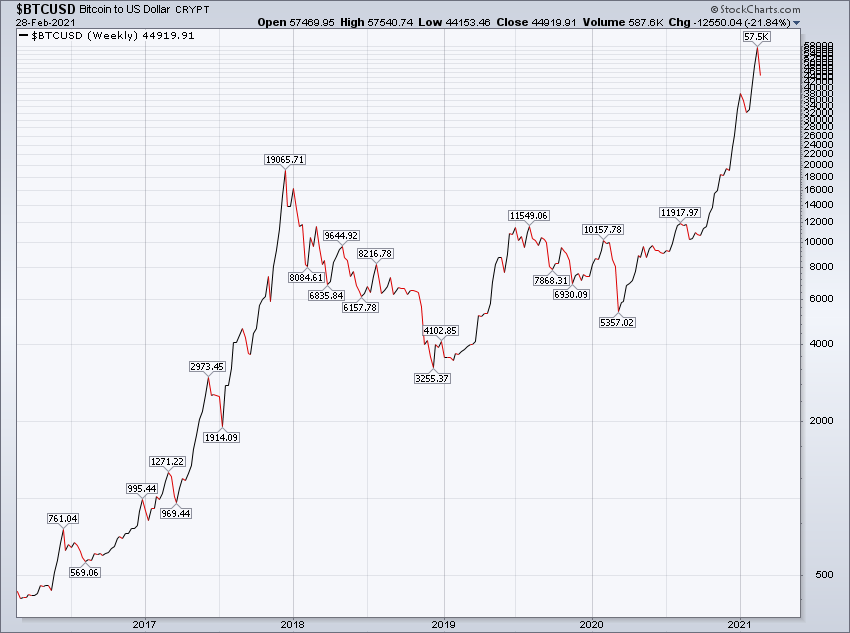
Last but not least, Bitcoin (BTC) is finally taking a breather.
It's hard to spot it on the weekly chart below but BTC is presently down -21.84% for the week. The fact that it looks like barely a scratch on the chart below is so Bitcoin.
Happy Sunday!
Steve & RickThis material is being provided for client and prospective client informational purposes only. This commentary represents the current market views of the author, and Nerad + Deppe Wealth Management (NDWM, LLC) in general, and there is no guarantee that any forecasts made will come to pass. Due to various risks and uncertainties, actual events, results or performance may differ materially from those reflected or contemplated in any forward-looking statements. Neither the information nor the opinions expressed herein constitutes an offer or solicitation to buy or sell any specific security, or to make any investment decisions. The opinions are based on market conditions as of the date of publication and are subject to change. All data is sourced to stooq.com and stockcharts.com. No obligation is undertaken to update any information, data or material contained herein. Past performance is not indicative of future results. Any specific security or strategy is subject to a unique due diligence process, and not all diligence is executed in the same manner. All investments are subject to a degree of risk, and alternative investments and strategies are subject to a set of unique risks. No level of due diligence mitigates all risk, and does not eliminate market risk, failure, default, or fraud. It should not be assumed that any of the securities transactions or holdings discussed were or will prove to be profitable, or that the investment recommendations or decisions we make in the future will be profitable, or will equal the investment performance of the securities discussed herein. The commentary may utilize index returns, and you cannot invest directly into an index without incurring fees and expenses of investment in a security or other instrument. In addition, performance does not account other factors that would impact actual trading, including but not limited to account fees, custody, and advisory or management fees, as applicable. All of these fees and expenses would reduce the rate of return on investment. The content may include links to third party sites that are not affiliated with NDWM, LLC. While we believe the materials to be reliable, we have not independently verified the accuracy of the contents of the website, and therefore can't attest to the accuracy of any data, statements, or opinions.
