The S&P 500 declined -2.31% this week with Friday's close at 3,426.96.
The index traded up to a new all-time high at 3,588.11 on Wednesday, a drawup of 2.28% from the prior Friday's close. We closed the session on Wednesday at 3,580.84, a new all-time high daily close for the S&P 500, but that's when the turbulence would ultimately arrive. For each of the last two weeks we've written that "prices don't move linearly forever" and the price action on Thursday and Friday finally illustrate our point.
The S&P 500 traded down -6.46% from Wednesday's close in a little more than one trading session, bottoming at 3,349.63 on Friday morning. This is the single largest two-day drawdown from an all-time high daily close that the S&P 500 has ever recorded, at least since 1970. On a closing price basis, the index's -4.30% decline the last two days is the second largest two-day decline from an all-time high daily close that the S&P 500 has ever recorded. We've written a lot over the last few years about how the S&P 500 trades like there's an on/off switch. The price action the last two days was as if someone turned the switch off.
The chart below is a 30-minute chart of the S&P 500 the last twenty days. It can now be used as an exhibit in supporting the definition of "escalator up, elevator down".

The fact that the S&P 500 traded down to the ~3,350 price level is not that surprising to us. In last week's Update we wrote:
"Broadly speaking, what's transpired the last two months is a great sign for the intermediate term. However, a pullback is truly a matter of "when" not "if", and further upward extension from here will only exacerbate the pullback we experience.
We'd ask the S&P 500 to take a break the front half of September, perhaps declining -3-5% back toward the ~3,350-3,400 level, prior to then continuing its advance. We doubt the market gods are listening, but it never hurts to ask."
The manner in which the S&P 500 traded down to ~3,350 is surprising to us. For starters, it's never happened before, and we'll never get used to the market behaving like it has an on/off switch. It goes against everything "fundamental" to the market. But 2020 is the year where what historically happens over weeks now happens over days (and you can substitute weeks with years and days with months).
So, where are we now? First, this week's sell-off actually hasn't generated much technical damage at the present moment. Friday's upside reversal, where the index went from down -3.06% during the session to close the session down only -0.81%, did clean things up in a major way, but we still finished the week in a cliffhanger.
The S&P 500 appears to have found support at prior resistance, at least temporarily. The index also held on to its 20-day simple moving average, pivoted higher from its 38.2% Fibonacci retracement, and has alleviated its massively "overbought" Relative Strength Index (RSI, top quarter of the chart).

Zooming in on the technology sector, the area that was most influential or responsible for this week's sell-off, the Nasdaq Composite (COMPQ) declined -9.99% from Wednesday's high into Friday's low before staging a meaningful rally into Friday's close, finishing down just -3.27% for the week.
Apple Inc. (AAPL) fell -3.08% this week, and Microsoft (MSFT) was down -6.40%. The Lebron James of the market went really, really cold this week, however COMPQ started to find its shot during Friday's session. COMPQ managed to close Friday's session almost exactly on its 20-day simple moving average, a level that's been a floor for the index on three prior tests since June (see yellow highlights below).

To say next week can be pivotal is an understatement.
Recency bias would suggest this week's sell-off is merely corrective; a sharp, fast, scary downdraft that only interrupts our relentless rally, it doesn't end it. Recency bias would also suggest that it won't take the S&P 500 that long to recover this week's sell-off.
Consider that the S&P 500 declined -5%-6% over two days in both April and May, yet recovered everything it lost in a matter of days. It declined more than -8% over five days in June, yet recovered everything it lost in about a month. In the event the S&P 500 can find meaningful upside over the week ahead, it will fuel the idea that this week's sell-off was the breather we've been looking for and it's onward and upward from here. Remember, everything is moving at warp speed in 2020, not only the sell-offs but the subsequent rebounds too.
Alternatively, if selling persists on Tuesday it will continue to give us deja vu to February of 2020. The parallels between the last two days and the two days from February 27th and February 28th are uncanny.
On February 27th the S&P 500 declined -4.42% and on February 28th we traded down another -4.13% during the session, but finished down just -0.82%. Our last two days? On September 3rd we declined -3.51% and on September 4th we traded down another -3.05% during the session, but finished down just -0.81%. Squeeze Metric's popular DIX indicator closed February 27th and 28th at 36.19% and 38.04%. DIX closed September 3rd at 35.50% and yesterday at 35.98% (click here). We're not prone to believing analogs are consistently predictive of anything, but we also recognize that price patterns often do repeat, even if the fundamental reasons used to explain "why" are different.
Finally, the main message from this week is volatility is back.
The price action on Thursday and Friday are volatility markers. The Volatility Index (VIX) jumped eight percentage points this week, or 33.93%, closing Friday at 30.75. This translates to implied volatility of roughly 2% daily changes for the S&P 500, i.e., there's a very good chance the index is trading up or down by 2% or more on a daily basis this week.
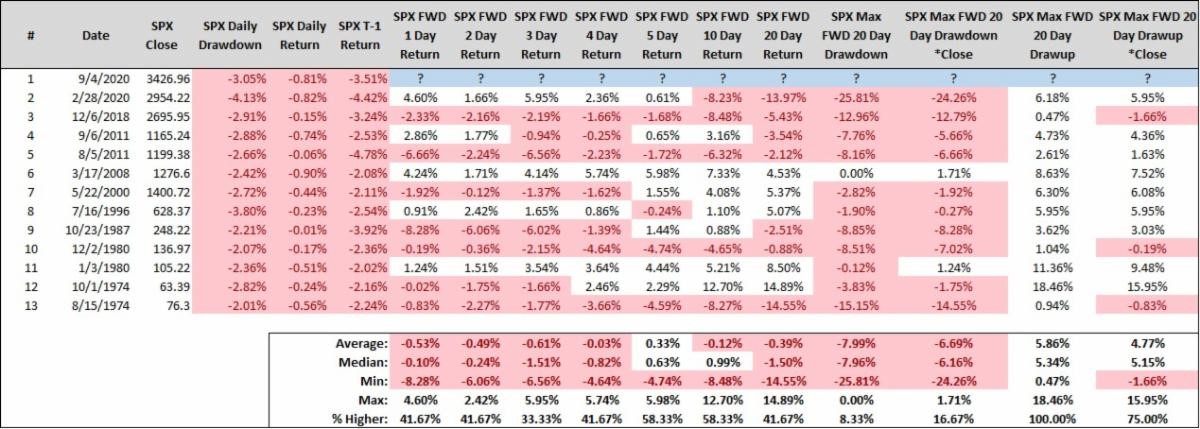
Furthering the volatility marker thesis, we quantified the price action over Thursday and Friday as a two-day price pattern defined as a -2% or worse daily decline yesterday, paired with a reversal day today, defined as a trading day with a -2% or worse daily decline from the prior session's close with a daily return that's between -1% and 0% (i.e., closing well off the daily lows one day after a big down day).
We're left with just 12 prior instances of this two-day pattern since 1970, but the price action over the forward one month following this pattern has been totally wild in all 12 prior instances. All 12 prior instances either have a gigantic drawdown, a gigantic drawup, or both, at some point over the forward one month. In other words, things are going to be volatile from here - the seat belt light is now turned on.
S&P 500 Primary Trend - Up
The S&P 500's primary trend is up or "bullish". While the seat belt light is turned on in the short term, short-term oscillations rarely change the index's primary trend. To earn the equity market's risk premium, long-term investors must be tolerable to short-term volatility as long as the primary trend remains labeled as up or "bullish". It isn't until short-term volatility evolves into more lasting and meaningful price damage, thereby reversing the primary trend from up or "bullish" to down or "bearish", that long-term investors consider rebalancing their portfolio. Two days does not a trend make, especially after a five-month winning streak, so we're certainly not there yet.
While there are a ton of mathematical ways to objectively define the S&P 500's primary trend, a monthly chart of the index generally displays the primary trend well. The picture below has all the attributes of an uptrend, at least as of today.

During uptrends, long-term investors are best served with an equity overweight across their portfolios' asset allocation (whether that overweight is 51% or 100% of their portfolio is based on individual investor attributes, everyone's situation is different) and relying mostly on passive investing methodologies.
The rules of the game change during downtrends. That's where equity underweight and alternative, or active, investing methodologies can outperform.
Take long/short equity funds as an example (commonly viewed as an alternative asset class), specifically 361 Global Long/Short Equity Fund (ticker symbol AGAZX). The fund has gotten completely trounced by the iShares S&P 500 Index Fund (ticker symbol IVV) over the last three years, with only slightly less volatility. IVV has returned 46.64% the last three years while AGAZX is higher by just 4.25%. Anyone passively investing in AGAZX during an uptrend for IVV is essentially throwing away money, especially when a fund like AGAZX has an expense ratio of 2.39% per year. If AGAZX shareholders are throwing away money, then it's like AGAZX management is stealing money.

We do believe it's all but certain that long/short funds like AGAZX will have their day in the sun, but that's far more likely to occur when the S&P 500 experiences a sustained bear market, or downtrend. Again, we're not there yet.
This illustrates why we believe the most important attribute to investing for success over time is a long-term investor's ability to adhere to a systematic, rules-based, objective process that establishes asset allocation and security selection policy based on the primary trends across asset classes, and the relative strength across individual sectors and/or securities. Strive to invest like a robot, as a robot optimizes what it can control and ignores everything that it can't.
More Mean Reversion: Lumber and Crude Oil Take A Hit
Perpetuating this week's theme that "prices don't move linearly forever" is lumber, which declined -16.31% this week with Friday's close at $641.50.
We wrote about lumber's meteoric rise two weeks ago (click here) so naturally it's only right we share when it has come crashing down a bit closer to earth...

Crude oil also found a sharp decline this week, falling -7.45% with Friday's close at $39.77. Like the S&P 500, and lumber, this is the worst week for crude since the summer months.

So, this week serves as a reminder that risk is real. Stocks, or any investment for that matter, don't "only go up".
In the world of investing, when things go really, really right for a few months, things are then likely going to go wrong for a few weeks shortly thereafter. The good news is that after things go wrong for a few weeks, things usually get back to their winning ways. For now, volatility is back, and we anticipate things being wild for the weeks ahead, but we believe this turbulence is only going to be temporary and the S&P 500 will be back to setting new all-time highs in the fourth quarter.
Please be cautious with the heat lingering around San Diego this weekend!
This material is being provided for client and prospective client informational purposes only. This commentary represents the current market views of the author, and Nerad + Deppe Wealth Management (NDWM, LLC) in general, and there is no guarantee that any forecasts made will come to pass. Due to various risks and uncertainties, actual events, results or performance may differ materially from those reflected or contemplated in any forward-looking statements. Neither the information nor the opinions expressed herein constitutes an offer or solicitation to buy or sell any specific security, or to make any investment decisions. The opinions are based on market conditions as of the date of publication and are subject to change. All data is sourced to stooq.com and stockcharts.com. No obligation is undertaken to update any information, data or material contained herein. Past performance is not indicative of future results. Any specific security or strategy is subject to a unique due diligence process, and not all diligence is executed in the same manner. All investments are subject to a degree of risk, and alternative investments and strategies are subject to a set of unique risks. No level of due diligence mitigates all risk, and does not eliminate market risk, failure, default, or fraud. It should not be assumed that any of the securities transactions or holdings discussed were or will prove to be profitable, or that the investment recommendations or decisions we make in the future will be profitable, or will equal the investment performance of the securities discussed herein. The commentary may utilize index returns, and you cannot invest directly into an index without incurring fees and expenses of investment in a security or other instrument. In addition, performance does not account other factors that would impact actual trading, including but not limited to account fees, custody, and advisory or management fees, as applicable. All of these fees and expenses would reduce the rate of return on investment. The content may include links to third party sites that are not affiliated with NDWM, LLC. While we believe the materials to be reliable, we have not independently verified the accuracy of the contents of the website, and therefore can't attest to the accuracy of any data, statements, or opinions.
