The S&P 500 declined -1.22% this week with Friday's close at 4,538.43.
The index has now declined two weeks in a row and closed Friday -3.40% below our all-time high weekly close at 4,697.96 from just three short week ago. The index came out of the gate strong on Monday, trading as high as 4,672.95, only to then plunge all the way down to 4,560 on Tuesday. That was definitely not the type of "turnaround Tuesday" we discussed in last week's Update. The best word to describe the price action this week is volatile. The S&P 500 increased or decreased by 1% or more each and every day this week, and the last six days in a row overall.
Coming into this week we were looking for the index to "to bend but not break", which we described as selling pressure being contained in the ~4,525-4,550 price region and the index then finding its footing.
Instead, the S&P 500 didn't like what it heard from Jerome Powell (click here) and his slant toward following through with an "accelerated taper" or bringing an end to exceptionally accommodative monetary policy, and subsequently traded down to 4,495.12 on Friday. From there, the index maybe found its footing...it's still too early to tell. Friday traded up 0.96% the final hour of the session, putting some lipstick on the pig by turning what would have been a second consecutive -2% weekly decline into just a -1.22% weekly decline.

Quantitatively, we can define the last three weeks as a sharp, fast pullback from all-time highs. If we identify all three-week periods where the S&P 500 closed at a new all-time high weekly close, and then recorded a two-week losing streak that declines -3% or more, we're left with 28 prior instances since 1970. Interestingly, the S&P 500 has closed higher one month later 24 out of 28 times for average returns of 1.24%.
However, 6 of the last 9 instances saw the S&P 500 close lower two weeks later, suggesting it may take another couple of weeks for Santa to make his way down Wall Street. Additionally, the 4 losers one month later were gigantic losers, with each of the four declining -8.35% or more. So, historically speaking, 85% of the time we're closer to the end of this corrective wave for the S&P 500 and 15% of the time we're only getting started. At the moment, it feels like we're closer to the beginning rather than the end of this downdraft, and admittedly something does feel off, but feelings have absolutely no place in forecasting the price of the S&P 500.

Sector performance was a mixed bag this week. The utilities sector was the top performer, rising 0.96%, while the communications sector was the worst performing sector, falling -3.21%. Technology, consumer staples, energy, and the industrial sectors all outpaced the S&P 500 this week, falling between -0.54%-0.98%.
Meanwhile, the materials, financials, and consumer discretionary sectors all underperformed the S&P 500 this week, each declining more than -1.26% for the week. Collectively, the "re-opening trade" was a mirror to the technology trade this week with the S&P 500 equal weight index (SPXEW) performing in line with the traditional market capitalization weighted S&P 500 index (SPX).
The Volatility Index (VIX) closed the week at 30.67, its highest weekly close since January of this year.
VIX weekly closes at 30.67 imply daily changes for the S&P 500 of +/- 2%, so over the week ahead it's likely that the S&P 500 continues to trade up or down by ~45 points on a daily basis. We prefer Ferris wheels to roller coasters, so this is certainly something we don't enjoy.
However, do keep in mind that while this is working against us at the moment, this degree of volatility is expected to work for us into the future. The best of returns for the S&P 500 follow the deepest of "oversold" conditions, or time periods of poor performance for the S&P 500. Taking the VIX as an example, there is no telling how sharp, fast and violent the upside explosion will be when the VIX begins its descent back down toward the 15-20 levels.
Ultimately, we continue to believe this selloff will prove to be "transitory" (pun intended) and the index will resume its primary uptrend and trade to new all-time highs in the first quarter of 2022.
Hey...history would suggest we're going to be correct 85% of the time. We'll take those odds; it pays to be an optimist in the world of investing.
S&P 500 Primary Trend - Up
The S&P 500 put the month of November in the books on Tuesday, finishing with a monthly decline of -0.83%. This leaves November as the 27th calendar month to trade up to a new all-time high during the month only to then finish the month in the red, but not down more than -3%. As we shared last week, these types of reversal months have generally marked temporary pauses within primary uptrends rather than being correlated to the end of primary uptrends. In other words, while recent weakness does leave us feeling like the world is ending - the world probably isn't ending.
Our work continues to label the primary trend as up or "bullish".

There's an old and great phrase in the world of investing:
"When in doubt, zoom out!".
The thought process behind the quote is to always keep the bigger picture in mind, to focus on the forest, not the trees. When referencing the chart above, does the price of the S&P 500 show any signs of trouble? Unless someone argues that the rally has simply climbed too far, too fast and is too good to be true, there's absolutely nothing to worry about yet as far as the bigger picture for the S&P 500. And we've written countless number of words detailing why a rally that is defined as too good to be true continues to be true far more often than not.
From a fundamental perspective, part of why we continue to have conviction in forecasting positive performance for the S&P 500 over the coming months is the fact that "TINA" (an acronym for "there is no alternative") is getting more attractive by the day. Given the S&P 500's recent selloff, there has been a "flight to safety" that has left the yield on a 10-year Treasury bond at just 1.35%. Heck, the yield on a 30-year Treasury bond closed Friday at 1.69%, its lowest daily close since the first trading day of 2021.
With the inflation narrative seemingly sprinting away from "hyperinflation" and toward "disinflation", it's important to note that real yields are going to remain negative for the foreseeable future, even if we see a ton of disinflation. This provides a tailwind to stocks whereby the lower the S&P 500 trades, and the lower yields fall, the more attractive the S&P 500 becomes relative to the fixed income asset class.
Behaviorally, when the annual expected cash flow from the dividends of investing in the S&P 500 equals the cash flow from a 10-year Treasury bond, market participants have tended to be eager buyers of stocks. Eager buying interest is what was missing this past week, but with yields across the curve plunging it's only a matter of time before eager buyers find their way toward stocks. Remember, patience and a plan beats panic every single time over the long run.

Crypto Crash, Commodities Crash, Last Year's Winners Crash
An update on the random crashes we've seen across the investable universe of late:
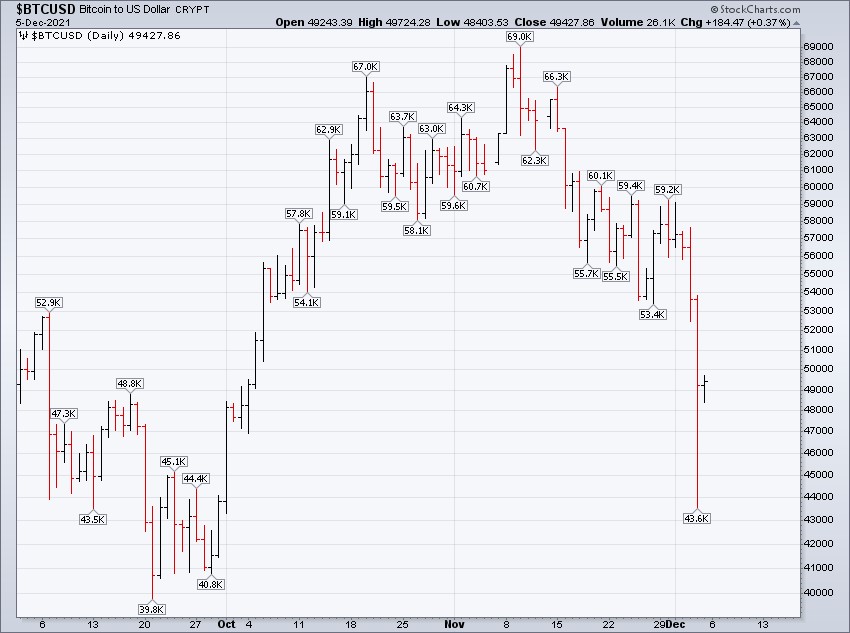
Bitcoin crashed on Friday night, falling from ~$58,000 down to ~$44,000, a decline of roughly -25% in less than 24 hours.
Ironically, this degree of volatility is the norm in the cryptocurrency space and it's why the asset classes returns are as strong as they are. Where there's pain there's gain, and -25% in less than 24 hours is a lot of pain.
The S&P GSCI Commodity Index (GTX) fell -2.88% this week, its third weekly decline in a row. GTX is now down -12.09% since October's high at 2,949.16. We find Powell's abandonment of the term "transitory" (click here) totally ironic given what's transpiring for GTX as the moment.

It seems like every week as of late a popular stock from 2020 gets obliterated, and this week was DocuSign's (DOCU) turn. We absolutely love DocuSign's product, but the market absolutely hated DocuSign stock this week. DOCU fell -45.88% this week and no that's not a typo.

DOCU's plunge is par for the course thus far in 2021. It feels like virtually all of last year's rising stars have become this year's failures. The great Charlie Bilello posted the percent distance from all-time highs for some of 2021's most popular stocks, listed by ticker symbol.

Happy Sunday!
Steve & RickThis material is being provided for client and prospective client informational purposes only. This commentary represents the current market views of the author, and Nerad + Deppe Wealth Management (NDWM, LLC) in general, and there is no guarantee that any forecasts made will come to pass. Due to various risks and uncertainties, actual events, results or performance may differ materially from those reflected or contemplated in any forward-looking statements. Neither the information nor the opinions expressed herein constitutes an offer or solicitation to buy or sell any specific security, or to make any investment decisions. The opinions are based on market conditions as of the date of publication and are subject to change. All data is sourced to stooq.com and stockcharts.com. No obligation is undertaken to update any information, data or material contained herein. Past performance is not indicative of future results. Any specific security or strategy is subject to a unique due diligence process, and not all diligence is executed in the same manner. All investments are subject to a degree of risk, and alternative investments and strategies are subject to a set of unique risks. No level of due diligence mitigates all risk, and does not eliminate market risk, failure, default, or fraud. It should not be assumed that any of the securities transactions or holdings discussed were or will prove to be profitable, or that the investment recommendations or decisions we make in the future will be profitable, or will equal the investment performance of the securities discussed herein. The commentary may utilize index returns, and you cannot invest directly into an index without incurring fees and expenses of investment in a security or other instrument. In addition, performance does not account other factors that would impact actual trading, including but not limited to account fees, custody, and advisory or management fees, as applicable. All of these fees and expenses would reduce the rate of return on investment. The content may include links to third party sites that are not affiliated with NDWM, LLC. While we believe the materials to be reliable, we have not independently verified the accuracy of the contents of the website, and therefore can't attest to the accuracy of any data, statements, or opinions.
