The S&P 500 gained 0.33% this week with Friday's close at 6,481.50. Friday's close is a new all-time high weekly close.
The price action this week was frenetic and yo-yo-like. The index traded poorly to start the week, trading down to Tuesday's low at 6,360.58, a decline of -1.54% to kick off the week. However, the index then found strength from there, climbing to a new all-time high at 6,532.65 early in Friday's session. But in yo-yo fashion, Friday's strength didn't last and the index reversed lower into the close, taking away what would have been our first weekly close above the 6,500 mark.
The narrative for Friday morning's strength was a much weaker than expected jobs report (click here), and the narrative for Friday's downside reversal was a much weaker than expected jobs report!
Based on the former narrative, market participants rapidly adjusted their rate cut expectations here in 2025, which is perceived as a plus. But based on the latter narrative, rate cuts in response to a weakening labor market are perceived as a negative. Friday's volatile session indicates market participants are in the process of discounting what lies ahead, a sort of tug-of-war between the optimists, who believe everything will be just fine, and the pessimists, who believe the combination of ascending inflation, a continued trade war and a weakening labor market create a recipe for "stagflation" (click here).
The technical picture for the S&P 500 remains cloudy with limited visibility.
Since turning the calendar to August, the index has been mostly crawling to the upside. The S&P 500 is higher by 2.24% since July's monthly close at 6,339.39. This too is a tale of two sides of the coin. On one side, the index has shown great resilience continuing to rise in the face of overbought conditions, seasonal weakness and a mixed bag of economic data. On the other side, crawling to the north in spite of everything we just mentioned sets the stage for an escalator up and elevator down scenario.
We've been calling for the S&P 500 to take a breather for about a month now. Frankly, it's at the point where we believe it's a "now or never" scenario. If participants aren't willing to sell 'em now, in the face of the uncertainty created by pairing together this Friday's jobs report with last Friday's core PCE report (click here), then maybe the conclusion is the consolidation we've seen in August and September is the breather. The price action the remainder of September is pivotal in our view and if we had to bet, we'd bet things are about to get bumpy.
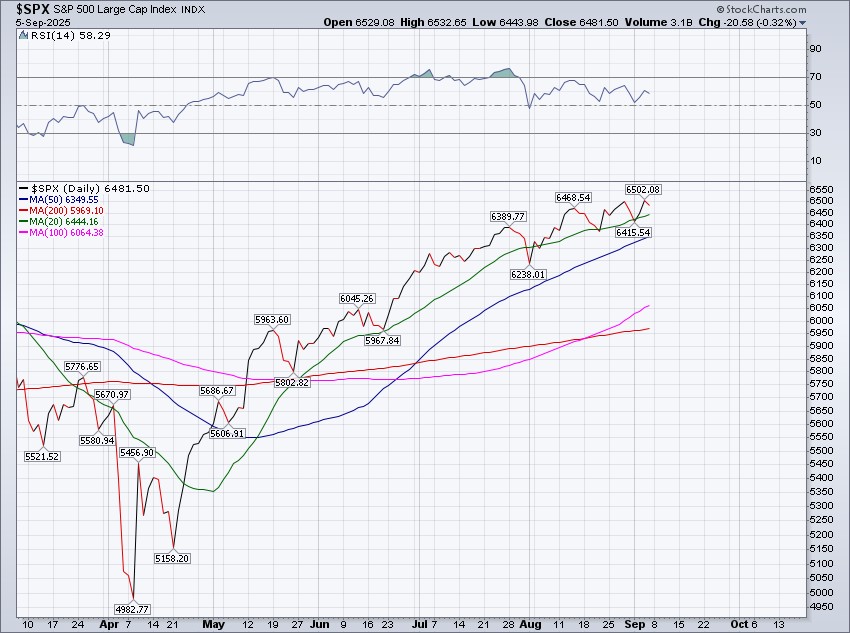
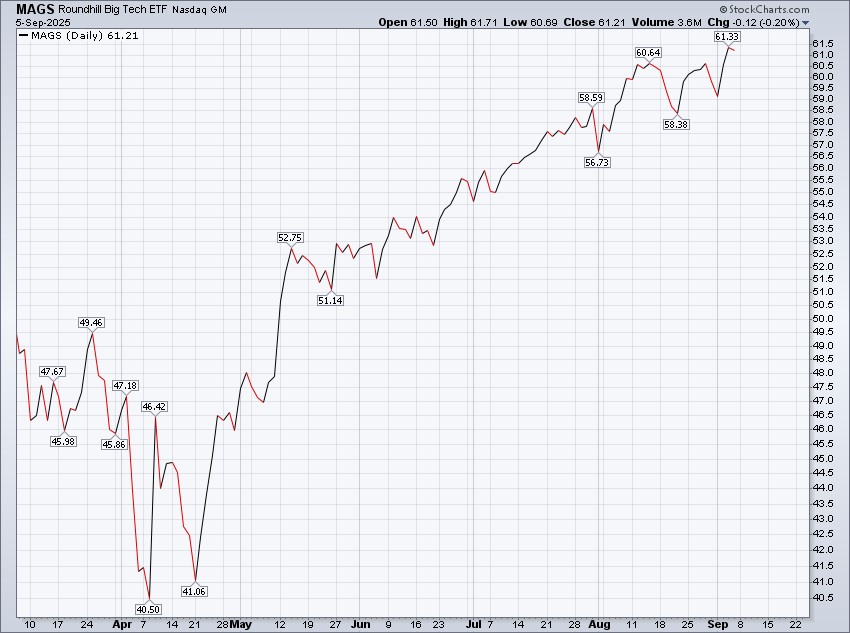
Market internals were a mixed bag this week. Communication services surged nearly 3%, almost entirely attributed to Alphabet's (GOOG) weekly gain of 10.13% (click here). Consumer discretionary gained more than 1% this week too, almost entirely attributed to Tesla's (TSLA) weekly gain of 5.08%. Laggards this week were utilities, financials and energy, all of which fell more than -1%. Leadership remains narrow, and the S&P 500's direction is mostly influenced by large market capitalization stocks. For example, the S&P 500 Equal Weight Index (SPXEW) fell -0.14% this week.
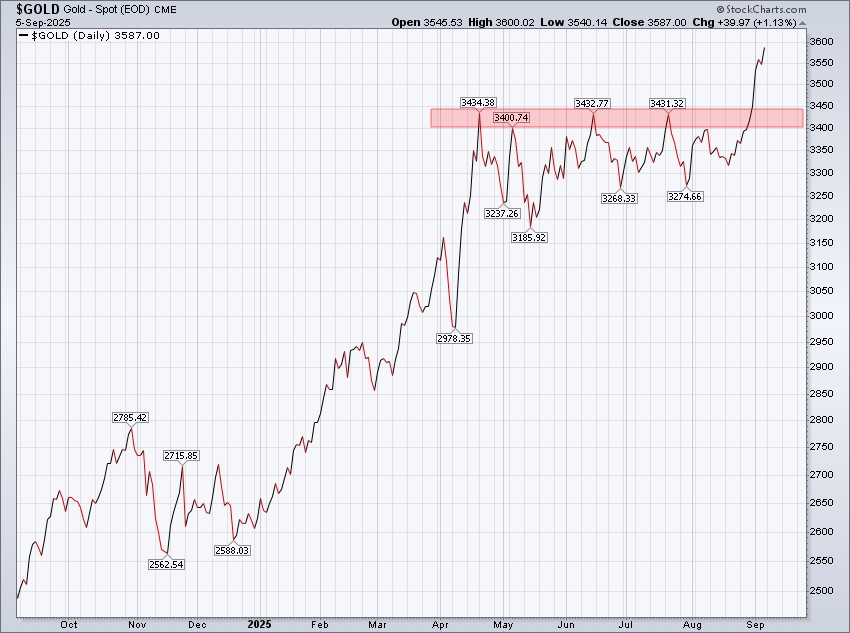
Perhaps the biggest story this week, in terms of price action, was the continued surge higher for gold.
Gold gained 3.99% this week with Friday's close at $3,587. The metal has increased three weeks in a row and has broken out nicely to the upside of a bullish consolidation pattern. The primary trend for gold is up across any and all time frames, and there are no known levels of "resistance" on the charts. Consider this too another sign of "stagflation" as gold loves "stagflation", historically speaking.
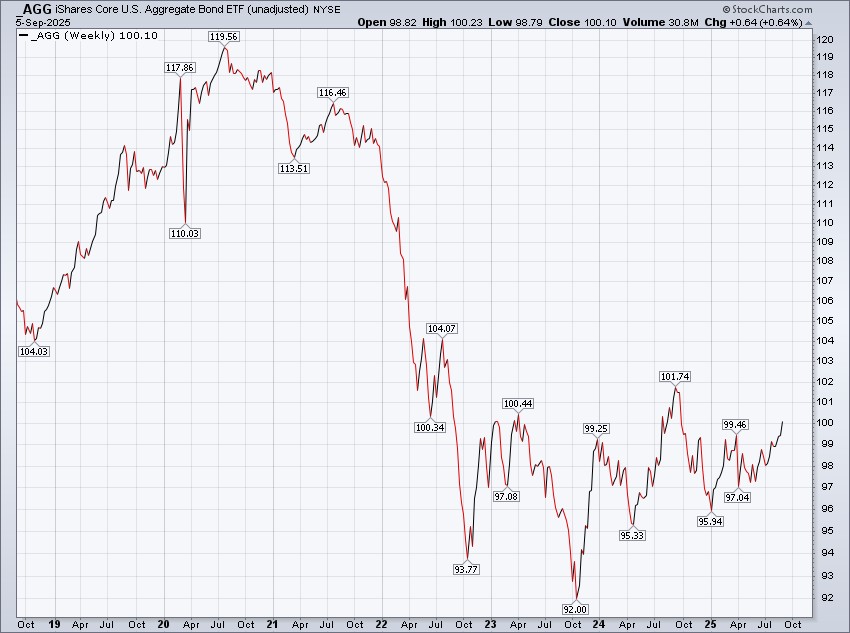
Zooming over to the bond market, bond prices jumped to the upside this week, meaning interest rates plunged across the yield curve.
The yield on a 10-year United States Treasury bond (UST10Y) fell 16 basis points this week with Friday's close at 4.08%. Friday's close is the lowest weekly close for UST10Y since March.
As for the week ahead - it's a bit dramatic to write, but the entirety of this week comes down to inflation data and its perceived impact on monetary policy decisions, specifically the Fed's decision on interest rates the remainder of 2025.
Following Friday's jobs report, participants, collectively, are pricing in a 75% chance of the federal funds rate finishing 2025 at 3.50-3.75%. That's three -0.25% rate cuts before the end of the year, one each in September, October and December.
S&P 500 Primary Trend - Up
The S&P 500's primary trend is up, or "bullish". While the seat belt light is turned on in the short term, short-term oscillations rarely change the index's primary trend. To earn the equity market's risk premium, long-term investors must be tolerable to short-term volatility as long as the primary trend remains labeled as up, or "bullish". It isn't until short-term volatility evolves into more lasting and meaningful price damage, thereby reversing the primary trend from up or "bullish" to down or "bearish", that long-term investors consider rebalancing their portfolio. We're certainly not there yet.
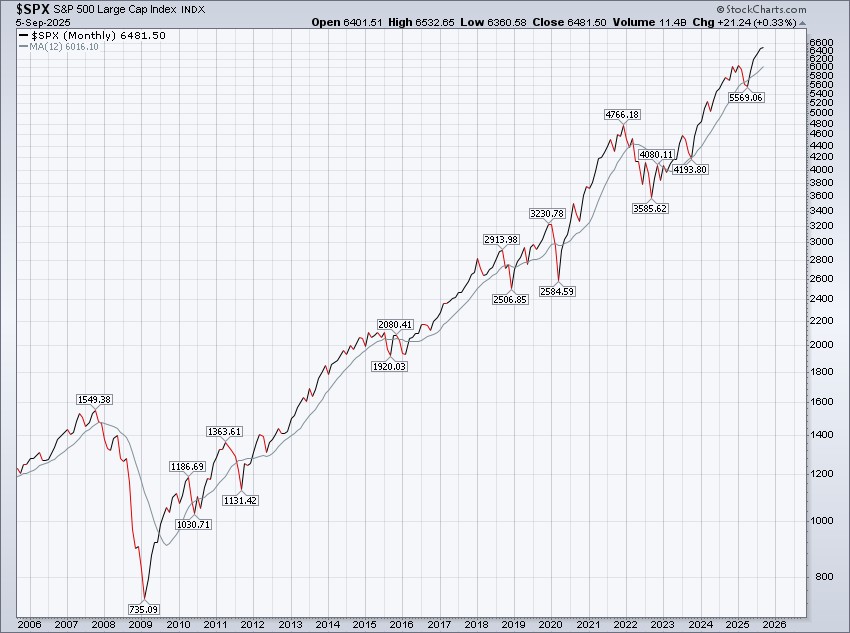
While there are a ton of mathematical ways to objectively define the S&P 500's primary trend, a monthly chart of the index generally displays the primary trend well.
The picture below has all the attributes of an uptrend, at least as of today. The index closed August at a new all-time high monthly close and is on a four-month winning streak. It's nothing but sunny skies when looking at the forest as opposed to the trees.
During uptrends, long-term investors are best served with an equity overweight across their portfolios' asset allocation (whether that overweight is 51% or 100% of their portfolio is based on individual investor attributes, everyone's situation is different) and relying mostly on passive investing methodologies.
Happy Sunday!
Steve & Rick