The S&P 500 gained 1.67% this week with Friday's close at 3,699.12.
Friday's close is another new all-time high daily and weekly close for the index. For the second week in a row we set our weekly low on Monday and our weekly high on Friday, a sign of ascending buying interest throughout the week. We traded down to 3,594.39 on Monday only to then climb more than 100 points into Friday's weekly high at 3,699.20. Collectively, market participants continue to demonstrate eager buying interest into lower prices for the S&P 500. This is an encouraging sign regarding where prices are headed over the intermediate term.
Referencing back to last Sunday's Update, we wrote that last week's advance left us in a prime position to move toward the ~3,700 region:
"This would set the stage for a move toward the ~3,700 price region over the week ahead, and that would have us yelling "touchdown!" (and Steve's a Jets fan so he hasn't been yelling that often this year)."

The ironic part about the "touchdown" analogy is that after you score a "touchdown" you give the ball back to the other team and they then try to score some points of their own. If we view the price of the S&P 500 as a football game between "bulls" and "bears", then over the last ten weeks the "bulls" have scored a ton of points while the "bears" have gone three and out repeatedly. We can't help but wonder if the "bears" are finally going to put a drive together.
Quantifying the action, the S&P 500 has gained 12.15% the last ten weeks and that's a ton of points over a short period of time, all while closing at prices we've never seen before in the history of the index (i.e., new all-time highs).
The game has been totally lopsided, and historically speaking, this is indeed when the "bears" finally do tend to put some points on the board in the not too distant future.
Since 1990, there are 21 prior instances of the S&P 500 gaining 10% or more over a ten-week period while also closing week ten at a new all-time high. Interestingly, the "bears" have then scored some points over the forward one month more often than not, especially as of late.
The S&P 500's forward four-week (i.e., one month) returns have closed lower eight of the last ten instances for average declines of -0.77%.

Now, while the table above does support the idea of the "bears" scoring points at some point over the forward one month, it's by no means guaranteed to occur over the forward one month. We share this not to suggest the price of the S&P 500 is headed south at Monday's open, or even next week, but instead to suggest that should any selling pressure arise from here it's totally normal and to be expected given the degree of the advance we've witnessed the last ten weeks.
A pullback unfolding over the next month would be nothing out of the ordinary; it's like the pilot announcing there's normal turbulence on deck.
Prices don't move linearly forever, and short-term, temporary price declines are also a hallmark of primary uptrends. We just have to put up with them. So if you see some red on the screen over the short term there's probably no need to panic.
The reason there's probably no need to panic is illustrated by the column titled "SPX FWD 12 Week Return", which is measuring the S&P 500's price-only return twelve weeks after the "bulls" have scored a ton of points (i.e., where is the price of the S&P 500 after the index has gained 10% or more over a ten-week period while closing at a new all time high). This is where we can see that the "bulls" generally build on their lead, which is basically supporting the null hypothesis for stocks (i.e. stock prices rise over time). The S&P 500's forward 12-week returns have closed higher 17 of the last 21 instances, gaining 2.09% on average.
Putting it all together, the last ten weeks have been absolutely fantastic. The rally has broadened and breadth measures have skyrocketed. Sector rotation has been on full display, the energy sector has gained 19.92% the last three weeks, and small-cap and high-beta stocks have been absolutely roaring, supporting the idea of an "economic bonanza" in 2021. Sentiment has now swung away from "fear" and moved toward "greed" (click here). We've checked all of the "accumulation" boxes and it's why we believe in the idea of higher prices for the S&P 500 over the intermediate term. But, there's always a but...
A portion of great returns in the present almost always have to be paid back into the future. Over the short term, we're due for some form of a normal, healthy pullback. Additionally, we don't believe there is any durability in any continued advance from Friday's close. In other words, even if the S&P 500 trades up to 3,800, or even 3,850 here in December, the index will probably trade back down toward the ~3,550-3,600 price region at some point over the forward four to six weeks.
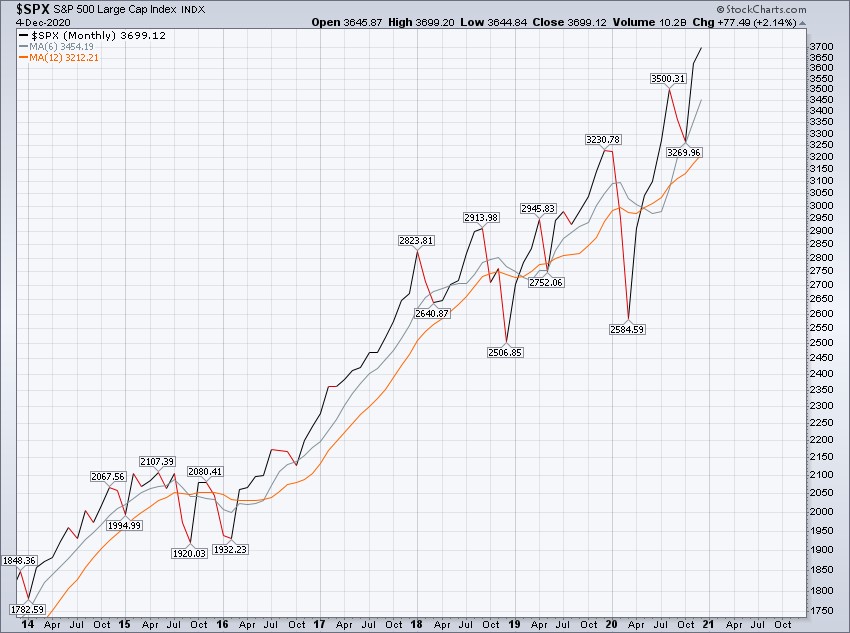
S&P 500 Primary Trend - Up
Our work continues to label the primary trend for the S&P 500 as up or "bullish".
During uptrends, long-term investors are best served investing in the most traditional sense of the word. The recipe for success during uptrends is an equity overweight across your portfolio's asset allocation and relying mostly on passive investing methodologies.
One of the more interesting narratives of 2020 is the resurgence of active management at the security selection level.
While the S&P 500 itself is having a strong year (which is shocking to write given everything that's transpired this year), there are pockets of the market that are having an exceptional year. This has allowed skilled active managers to thrive and one in particular, ARK Invest (click here), is absolutely crushing it this year.
ARK Invest has five actively managed exchange-traded funds (ETFs). They say a picture is worth a thousand words, so the chart below illustrates the year-to-date returns of all five of their ETFs relative to the S&P 500 itself.

Now, we have no idea if ARK's actively managed ETFs will continue to outperform moving forward. We've all heard the phrase "past performance isn't indicative of future results". We share this not to endorse ARK ETFs, but instead to illustrate support for analyzing the merits of "active management" at the security selection level, rather than just assuming "active management is dead".
From a philosophical/strategy perspective, we believe it's reasonable for long-term investors to diversify "how" they own stocks. This includes diversifying with passive and active strategies at both the asset allocation and the security selection levels. The idea of a long-term investor implementing a static, "one size fits all" asset allocation, with nothing but one or two of the broadest ETFs, is outdated in our opinion. It's missing a lot of low-hanging fruit.
To navigate an unprecedented future with an ever-changing market climate, we believe it's imperative that long-term investors diversify to pick up the low-hanging fruit. It's prudent to diversify "when" they own stocks (i.e., employing a rules-based approach toward tactical asset allocation decisions) and "how" they own stocks (i.e., leveraging both passively managed ETFs and actively managed ETFs based on relative strength criteria). Given broad equity market valuations, we believe these are some of the necessary tools to get the job done into 2021 and beyond.
Bonds Hanging On By A Thread, Gold Finds A Bid, Bitcoin Sets New ATH
The long-term Treasury bond market, as measured by the iShares 20+ Year Treasury Bond Index Fund (ticker symbol TLT) declined -3.03% this week with Friday's close at $155.20. TLT is now face-to-face with its lowest weekly close over the last six months. The yield associated with a 30-year U.S. Treasury bond closed Friday at 1.73%, its highest weekly close since February. TLT is presently at a fork in the road.

Interestingly, gold jumped 2.90% this week with Friday's close at $1,840, even in spite of yields rising sharply across the curve this week.
Broadly speaking, rising yields are detrimental to the price of gold...unless rising yields are a derivative of rising inflation expectations. Negative real rates can occur even in the face of sharply rising yields, and that would create upward momentum in gold prices (think the 1970s).

Finally, Bitcoin (BTC) set a new all-time high this week, climbing to $19,911.79.
The cryptocurrency is now face-to-face with its top from 2017 at the $19,870.62 marker. BTC did pull back to finish the week at $19,192.85 as it consolidates around prior resistance.
A breakout above $20,000 feels inevitable and it will see BTC move into uncharted territory.

Happy Sunday!
Steve & Rick