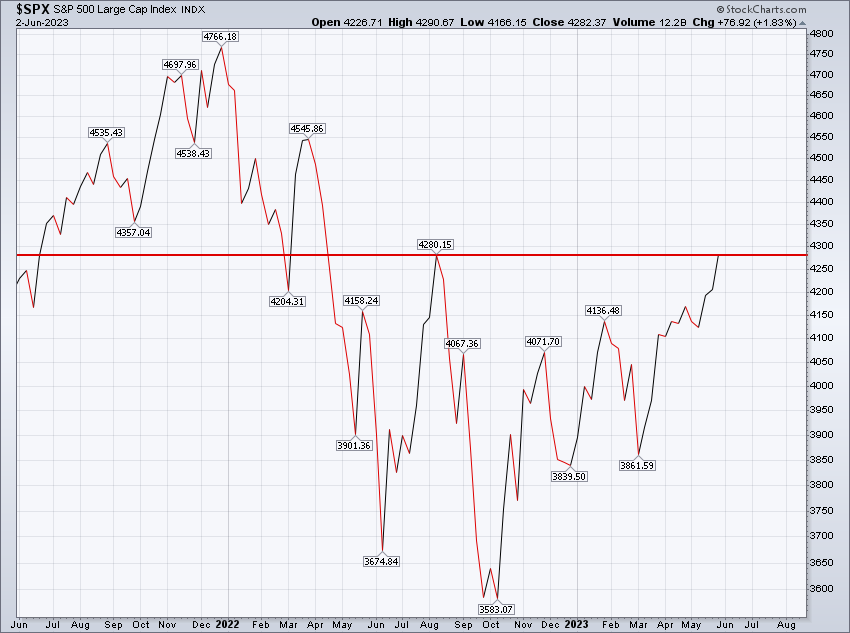
The S&P 500 gained 1.83% this week with Friday's close at 4,282.37. The index has now increased three weeks in a row and Friday's close is the highest weekly close since April 14, 2022.
The S&P 500 traded negatively to start the week, falling to our weekly low at 4,166.15 on Wednesday. But for the second week in a row the S&P 500 would take off like a rocket ship Thursday morning, finishing this week more than 100 handles higher than Thursday morning's low at 4,171.64. We never truly know exactly why the S&P 500 does what it does, but if it was 2nd and goal from the 1-yard line last Sunday, then we're screaming "touchdown!" this Sunday.

In each of our last two Updates we've written how the consolidation since early February has recharged the index's battery. Well, the index found the energy to burst to the upside this week. We wrote last week: "We'd love for the index to sprint to the ~4,300-4,350 level to break the "Groundhog Day"-like trading range between ~4,100-4,200". Naturally, we were pleased with what transpired this week.
Perhaps the most encouraging element of this week's price action came on Friday where the "breadth" of the market expanded in a material way.
Virtually all of this year's laggards led the charge higher on Friday. The S&P 500 gained 1.46% on Friday alone, accounting for the majority of the index's weekly advance, and the two worst performing sectors on the day were the technology and communications services sectors. Not too many folks had that on their bingo card. These two sectors have been carrying the market on their back for all of 2023, with both sectors up more than 30% on a year-to-date basis through Friday's close (that's shocking to write!).
But on Friday it was everything else that put the ball in the hoop. It would be like the Denver Nuggets winning game 2 tonight with Jokic and Murray having terrible nights and everyone else catching fire and bringing home the victory. Materials and energy gained more than 3%, small-cap stocks gained more than 4% and industrials gained 2.91%. The S&P 500 Equal Weight Index (SPXEW) beat the S&P 500 (SPX) by 0.70% on Friday, its best day of relative performance in months.
While one day does not a trend make, it's hard to not be a little bit excited about the idea of breadth expansion moving forward, or the idea that we see broad market strength forward-looking.
The first chapter in the climb from ~3,800-4,200 was clearly a technology story. Maybe the second chapter will be the everything else story, a story that can be the next 10% higher for the S&P 500. Time will certainly tell.

On the weekly chart, we're staring August 2022's high weekly close dead in the eyes too.
It may seem a bit counterintuitive to write about this week's "bullish breakout" when all it did was bring us face-to-face with more "resistance", but that's the hand we're being dealt.
It's the conundrum between Friday's price action presenting itself as being just the beginning of the market, collectively, broadening out by embracing the cyclicals and finding conviction in the "soft landing" narrative versus considerable levels of "resistance" from the not-so-distant past. If we had to guess, we do believe the odds favor Friday's moves being just the beginning of what we'll call a rotational "breadth rally", or an advance in market breadth driving what was formerly a narrow market higher.
The chart below shows the potential of a rotational "breadth rally".

All that said, we're always wary of "whipsaws" (click here), and the market knocked a lot off its "wall of worry" this week. This remains a very difficult market to forecast, with an incredibly wide range of future outcomes. What has changed, at least in our opinion, is our philosophical approach toward the market. The price action of the S&P 500 has done enough for us to now believe that the best is yet to come while also being prepared in the event the worst is just around the corner. We couldn't say that in December 2022 or even January 2023, but we believe the S&P 500 has earned the benefit of the doubt.
We have a relatively light week in front of us as far as market-moving catalysts, but we'd love to see follow-through to the upside and more evidence to support the idea that a rotational "breadth rally" is upon us.
S&P 500 Primary Trend - From Neutral to Drive?
The S&P 500 finished the month of May this week at 4,179.83, rising by 0.25%.
We can't help but chuckle a bit at what transpired in both April and May where we wrote week after week how pivotal the price action would be, and instead the S&P 500 just parked itself in neutral and did absolutely nothing for two months. So, maybe it's June that's going to be the pivotal month, and if the first two days are any guide then perhaps the pivot is truly to the upside.
The primary trend has a chance to solidify itself back in "drive" or "bullish" here in June.
The S&P 500 is currently trading above any and all widely followed monthly moving averages, and absolute and relative momentum remains positive across almost all time frames. Economic data remains mixed, but the biggest of variables (inflation data and forward-looking Fed policy) do appear positioned to improve meaningfully into the future (i.e., we're witnessing disinflation and the Fed "pause" and "pivot" probably aren't far off). What does all this mean for long-term investors?

Finally, it's incredibly easy to believe "this can't continue" and feel like the price of the S&P 500 is doomed.
While we have no greater insight into what truly lies ahead than any of our readers do, we do have complete and total conviction in the idea that anything is possible moving forward. That's a total opposite to feeling like "this can't continue", which is a negative bias regarding the future price action of the S&P 500.
Studying market history is part of what helps us find our conviction in the idea that anything is possible, forward-looking, or the idea that this can indeed continue.
Take the following study as an example: the table below lists all calendar years where the S&P 500 traded up by 10% or more on a year-to-date basis prior to May's monthly close and finished the month of May more than -5% below its all-time high monthly close. When these conditions are present the S&P 500 has continued to trade higher over time, rising more than 10% on average each and every single time a mere 8 months later.
This can't guarantee us these returns into the future, but it can guarantee us that the strong start to 2023 isn't a reason to believe "this can't continue". It definitely can continue (fundamental backdrop be damned!).

Happy Sunday!
Steve & Rick