The S&P 500 fell -0.71% this week with Friday's close at 3,906.71.
The index opened the holiday-shortened trading week on a high note, climbing up to 3,950.43 on Tuesday, a new all-time high. However, it was all downhill from there. Tuesday's session reversed lower, finishing the day in the red at 3,932.59, and the S&P 500 would close lower each and every day the remainder of the week while recording our first four-day losing streak of 2021.
Given what we shared last Sunday from Wayne Whaley, weakness this past week wasn't all that surprising. However, what was surprising was just how strong this past week's weakness was! Pun intended.
The S&P 500's four-day losing streak has only taken -0.71% off the value of the index, and there wasn't a single trading day that declined -0.50% or more this week. We only need our hands to count how many times we've seen this gentle of a four- day losing streak since 1990.

The question as of now is whether or not the S&P 500 has had enough rest.
If so, then we're ready to take another sprint to the north to finish off February, perhaps climbing toward the ~4,000 marker. Alternatively, if we need more rest then a trip down toward the ~3,820-3,850 region makes a lot of sense this week. Ironically, there's a market-moving catalyst this week in the form of President Biden's first State of the Union address (SOTU). Historically, the market does cheer this SOTU (i.e., the S&P 500 tends to increase over the two-day period covering the SOTU and the day after the SOTU).
In last week's Update we talked about the newfound synergy that's in place between both the Federal Reserve and federal government. President Biden, Janet Yellen, and Jerome Powell are all working together, harmoniously, to help spur economic productivity into the future. The month of February illustrates this trifecta perfectly.
First we heard from Jerome Powell on February 10th, and he pledged the Federal Reserve's full support moving forward. Then we heard from Janet Yellen this past week, and she actually called for even more stimulus moving forward (click here). Think about that: There is already a $1.9 trillion-dollar stimulus plan on the table that the house aims to vote on this week (click here). Pundits have estimated that should this $1.9 trillion-dollar stimulus pass it will effectively drop $450 billion dollars into consumers' bank accounts...and Yellen is discussing the idea of more stimulus on top of that! Ironically, we just learned what we already knew this week, which is if you hand consumers "free" money they will spend it (click here). We imagine President Biden's SOTU will complete the trifecta in telegraphing to the markets that he too is also sporting the "whatever it takes!" (click here) attitude.
Reviewing market internals this week, the market behaved as if it believes that the "whatever it takes" policy narrative is going to work in accelerating the economy.
The more economically sensitive S&P 500 Equal Weight variant (SPXEW) outpaced the traditional market-cap weighted S&P 500 by 0.94%. The re-opening side of the investable landscape really showed relative strength on Friday (hint: following Yellen's stimulus remarks) where the more cyclical areas of the market, like small- cap stocks, gained 2.09% while the S&P 500 closed red. The re-opening sectors of energy and the financials dominated this week with both rising by more than 2%, while the star of the COVID trade, the technology sector, declined by nearly -2% for the week.
We continue to believe investors need a diversified, barbell-like, approach toward equity allocations.
While the technology sector has carried the load for a long, long time, that's not going to be the case in the event where "whatever it takes" truly brings about an economic bonanza.
For the week ahead we'd obviously like to see the S&P 500 get back to its winning ways. The index hasn't recorded a two-week losing streak since October. February has been a fantastic month, but so was January up until this same point. We'd like to see February do what January couldn't...finish the month on a high note.
S&P 500 Primary Trend - Up
There are five trading days remaining in the month of February, and the S&P 500 is presently higher by 5.18% for the month.
Barring a crash to close the month (which brings back terrible memories to the final trading week of February last year), the S&P 500 will close this February at a new all-time high monthly close. We can't say we ever would have imagined that back in March of 2020, but as we always say - the market trades beyond the limits of imagination.

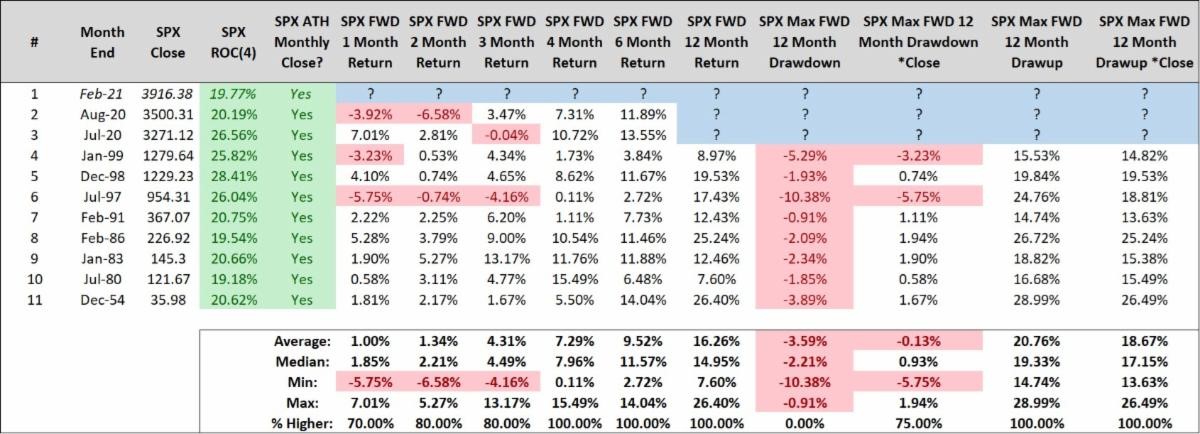
In the event the S&P 500 closes the month of February at 3,900 or higher the index will have gained at least 5% for the month, closed at a new all-time high monthly close, closed above its upper monthly Bollinger Band, and closed February with returns of a whopping 19.30% over just the last four months. After reading this your first thought is probably identical to ours: This can't possibly continue, right? While studying market history has its limitations, dispelling the idea that this can't continue definitely isn't one of them.
Since 1950, there are only ten four-month periods where the S&P 500 gained 19% or more and closed the month at a new all-time high. The first time this happened was in 1954 and the last time it happened was in August of last year. We'd bet that no matter whether it was 1954 or 2020, most investors probably felt like "this can't continue" too. Ironically, it's actually always continued! Historically the market always found a way to climb the "wall of worry".
Long-term investors must have a process to identify when to hold 'em and when to fold 'em.
RIght now, the evidence suggests it's a time to hold 'em, even if our emotions and feelings want us to believe otherwise.
Psychologically, we're all programmed to be risk averse when our portfolios are thriving. We become anchored to our higher account balances and we want to keep every single penny we've made. This leads many long-term investors to consider de-risking their portfolio (i.e., selling stocks) for no other reason than their portfolio's returns have been stellar. We can assure that de-risking your portfolio on the basis of stellar returns is a costly mistake more often than not.
Now, when there is evidence to suggest there is meaningful risk to your portfolio's returns, that's when risk should be managed. While we know the future does include the worst of times, it's clear we're still in the best of times right now. Until there's evidence of the worst of times being front and center, strive to sit tight and enjoy the ride.
Furthering The Reflation Narrative: Interest Rates Ripping, Copper Exploding, Bitcoin Booming
The "reflation" trade narrative we discussed last week took even more steps forward this week. Here were the highlights:
Interest Rates Ripping Higher
Bond prices have been in a secular "bull market" for decades, but it would appear that this "bull market" is over, at least temporarily.

Interest rates ripping to the north is a sign that the bond market too, collectively, believes in the "whatever it takes" narrative and its ability to "reflate" the economy (i.e., accelerate economic productivity and increase inflation). What will be interesting to see is just how steep the Fed will allow the yield curve to get in a sense. A steepening curve is a sign of confidence in forward-looking expectations for both the economy and inflation, but higher interest rates across the curve operate as a "tightening" of credit conditions, analogous to stepping on the economy's brake. We don't believe the Fed will sit back and allow yields to go wherever the market wants to take them. In other words, the very minute the market takes them to where the Fed doesn't want them, the Fed will probably act via yield curve control to put rates back where they want them. Remember, "whatever it takes".
This could fuel a Goldilocks scenario for stocks and risk assets as the Fed will allow the economy to run hot, to keep the pedal to the metal, in an effort to truly maximize their mandates. With retail now seemingly more involved in markets than ever before, perhaps this is a good thing as far as equality and the prospects for social mobility.
Copper Exploding
We're not sure we believe in the idea of calling it "Dr. Copper", but copper prices are absolutely ripping higher.

Bitcoin's Still Booming
Bitcoin has earned a "digital gold" moniker, and if market participants across both stocks and bonds, collectively, believe in the reflation narrative then it's only right that Bitcoin (BTC) continues to boom. BTC climbed beyond $57,000 this weekend. We have no words. Patrick O'Shaughnessy summarized our feelings perfectly when he wrote:

Happy Sunday!
Steve & RickThis material is being provided for client and prospective client informational purposes only. This commentary represents the current market views of the author, and Nerad + Deppe Wealth Management (NDWM, LLC) in general, and there is no guarantee that any forecasts made will come to pass. Due to various risks and uncertainties, actual events, results or performance may differ materially from those reflected or contemplated in any forward-looking statements. Neither the information nor the opinions expressed herein constitutes an offer or solicitation to buy or sell any specific security, or to make any investment decisions. The opinions are based on market conditions as of the date of publication and are subject to change. All data is sourced to stooq.com and stockcharts.com. No obligation is undertaken to update any information, data or material contained herein. Past performance is not indicative of future results. Any specific security or strategy is subject to a unique due diligence process, and not all diligence is executed in the same manner. All investments are subject to a degree of risk, and alternative investments and strategies are subject to a set of unique risks. No level of due diligence mitigates all risk, and does not eliminate market risk, failure, default, or fraud. It should not be assumed that any of the securities transactions or holdings discussed were or will prove to be profitable, or that the investment recommendations or decisions we make in the future will be profitable, or will equal the investment performance of the securities discussed herein. The commentary may utilize index returns, and you cannot invest directly into an index without incurring fees and expenses of investment in a security or other instrument. In addition, performance does not account other factors that would impact actual trading, including but not limited to account fees, custody, and advisory or management fees, as applicable. All of these fees and expenses would reduce the rate of return on investment. The content may include links to third party sites that are not affiliated with NDWM, LLC. While we believe the materials to be reliable, we have not independently verified the accuracy of the contents of the website, and therefore can't attest to the accuracy of any data, statements, or opinions.
