
The S&P 500 fell -0.27% this week with Friday's close at 7,722.72.
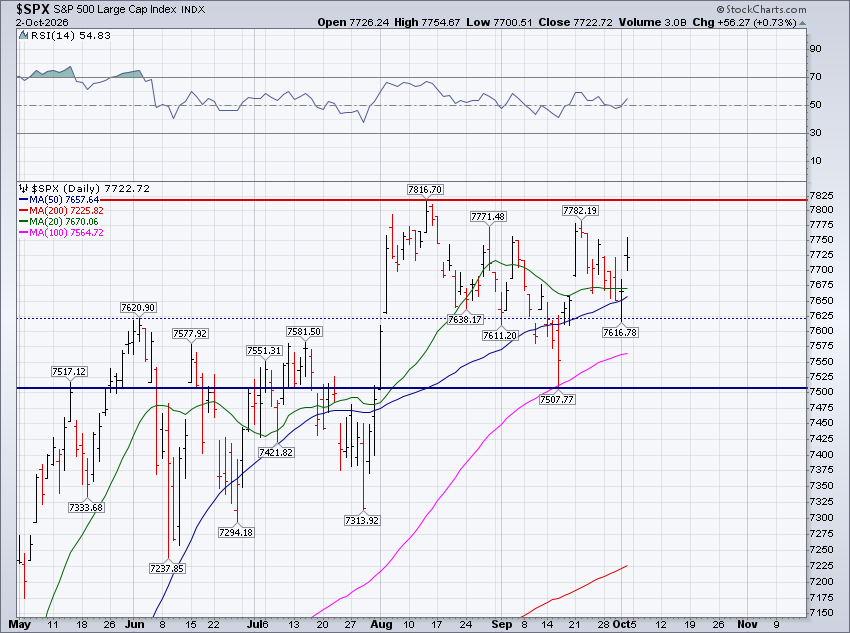
The index opened the week at 7,721.70, exactly 1.02 points below Friday's close. On the surface, virtually nothing happened. For the second week in a row, the primary narrative is the S&P 500's failure to launch. The index traded lower through the front half of the week, closing in the red Monday through Wednesday and reaching our weekly low of 7,616.78 on Thursday. Strength on Friday, where the index gained 0.73%, salvaged what was shaping up to be a far worse week. Friday's upside was at least correlated to the jobs report (click here), which was a textbook case of bad news being good news, as traders are now betting there is no additional rate hike coming in October (click here).
At this point, we've reached the stage where range rules apply.
That is, until the S&P 500 breaks out to new all-time highs or trades below support at ~7,500, there is absolutely no information value in the price action. The index has essentially traded nowhere since early June's peak at 7,620.90. The price thrust higher in August was ultimately the breakout that never was, and your authors are best described as patiently frustrated. Trading ranges, or prolonged periods of sideways trading, are the worst.
Interestingly, there is still a lot going on under the S&P 500's hood.
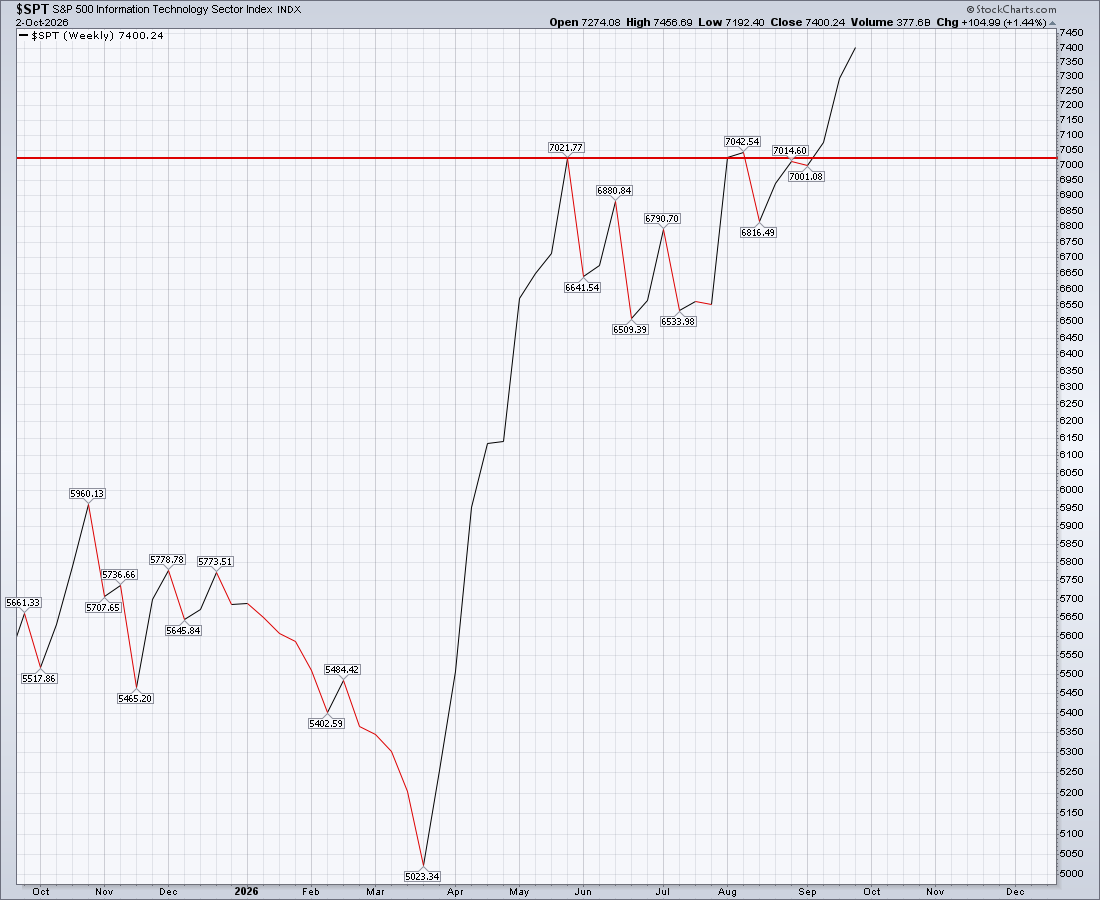
While the headline index was little changed this week, that outcome was mostly a derivative of the index's biggest and best player continuing to perform. The S&P 500 Information Technology sector (SPT) added another 1.44% this week and closed Friday at a new all-time high weekly close. SPT has now increased three weeks in a row and five of the last six overall. Frankly, the chart looks terrific. There are no range rules here, and there are no known levels of resistance anywhere on the chart.
We've written this many times over the last month, but the stock market and the market of stocks continue to tell two very different stories.
The S&P 500 Equal Weight Index (SPXEW) fell -0.71% this week and has now declined seven weeks in a row. We only have data for SPXEW dating back to 2003, but over the last 20-plus years we've seen a seven-week losing streak exactly one other time, the week ending 05/20/2022. That's incredibly rare.
At some point the depth of the lineup has to start hitting the baseball, because the alternative is a serious problem if the stars ever cool off. The stars can't stay hot forever and the role players can't stay cold forever (prices don't move linearly forever!). Something has to give, and which way it gives will likely influence whether the S&P 500 is breaking out to new all-time highs, or breaking down below the ~7,500 level in the fourth quarter.
The inflation story got some decent news this week courtesy of the August Personal Consumption Expenditures report, the Fed's preferred inflation gauge. Headline PCE held unchanged at 3.4% year over year while core PCE held unchanged at 3.0%, with both coming in 0.3 percentage points below expectations (click here). Pair a cooling labor market with cooling inflation and you have a Fed that is essentially in handcuffs here in October, which is why we'd bet against a hike at the October meeting.
Unfortunately, not even a cooling in inflation and a Fed pause could pump life into the bond market.
The price of a U.S. 10-year Treasury note fell -0.53% this week, its eighth consecutive weekly decline. The yield on the 10-year closed Friday at 5.28%, its highest weekly close since 2002. It's absolutely incredible that the weakness in bonds, and the corresponding surge higher in interest rates, hasn't spilled over into the equity markets. In other words, the combination of the S&P 500 in the 7,700s and the yield on the 10-year above 5% is not something anyone would have paired together, yet here we are.
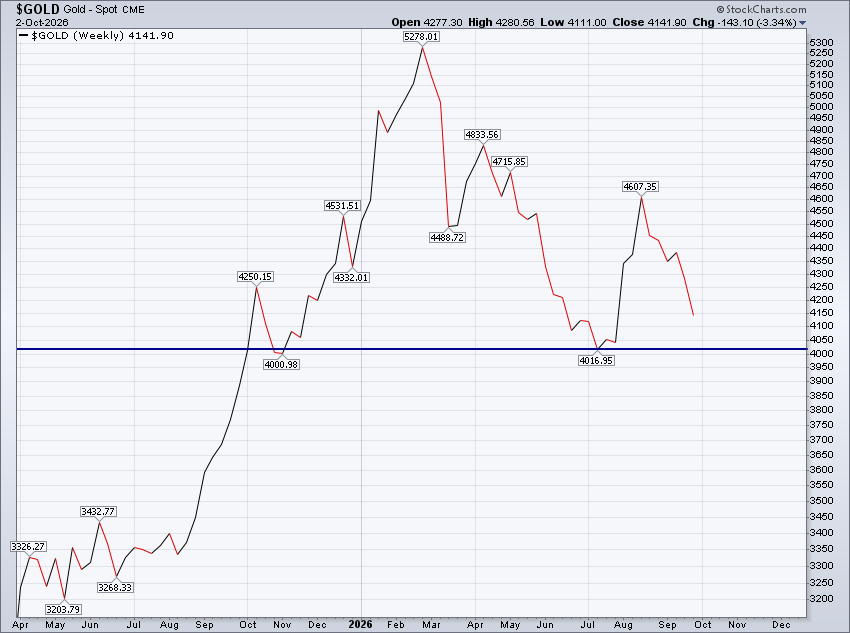
One area where higher rates have spilled over appears to be in the price of gold. Gold fell -3.34% this week with Friday's close at $4,141.90. Gold has now declined four of the last five weeks and is knocking on the door of critical support on its weekly chart at the ~$4,000 level.
As for the week ahead, it's a light week on the economic data front. But we'll hear from someone at the Fed almost every day this week. As we mentioned earlier, the S&P 500 needs to set new all-time highs to resume the primary uptrend. Minor support sits at the ~7,620 level with the ~7,500 zone as primary support not far below. Until one of those two things happens, the price action remains noise rather than signal, as frustrating as it sounds. As always, another exciting week awaits!
S&P 500 Primary Trend - Up
The S&P 500 closed the month of September on Wednesday at 7,651.54. The index fell -0.45% for the month, but September ultimately recorded as an "inside month", meaning September's monthly high and low were confined "inside" those of August. Inside months signal hesitation and overall skittishness across the actions of market participants, which aligns with the idea that range rules apply.
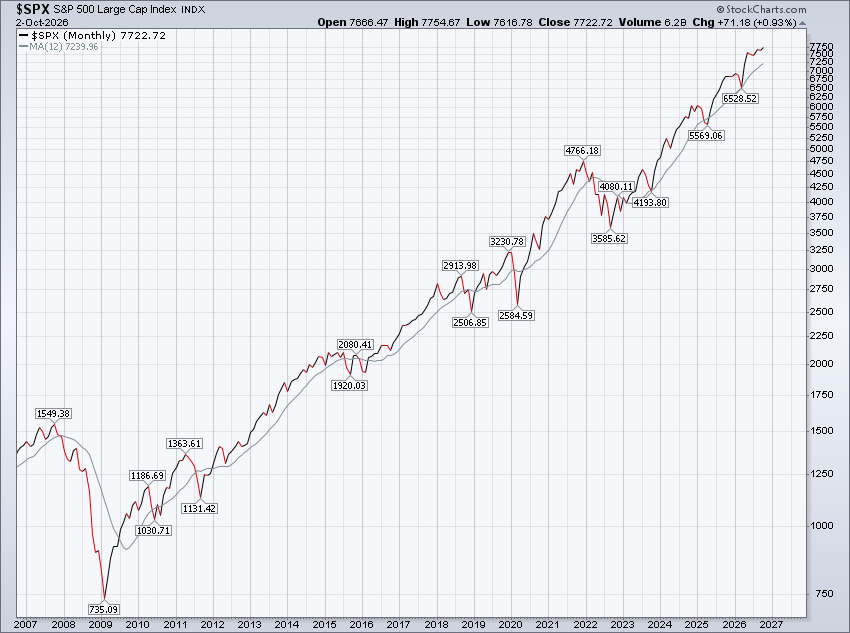
Our work continues to label the primary trend for the S&P 500 as up, or "bullish."
During primary uptrends, long-term investors are best served including the equity asset class across their portfolios' asset allocation and relying primarily on passive investing methodologies. You have to know when to hold 'em and know when to fold 'em in order to invest for success over the full market cycle. The idea is to hold 'em during the "bullish" portion of the cycle and fold 'em during the "bearish" portion. It's much easier said than done, since market cycles are nearly impossible to consistently predict.
Market cycles can, however, be identified with a bit more consistency, especially when using rules that are void of emotion, speculation and gut opinion. There are a myriad of prudent, intelligent and defensible rules out there to choose from. Ironically, which rules a long-term investor selects matters far less than that investor's ability to adhere to them during the most challenging of market climates. Maniacal discipline trumps just about everything else in the world of long-term investing. Pun intended.
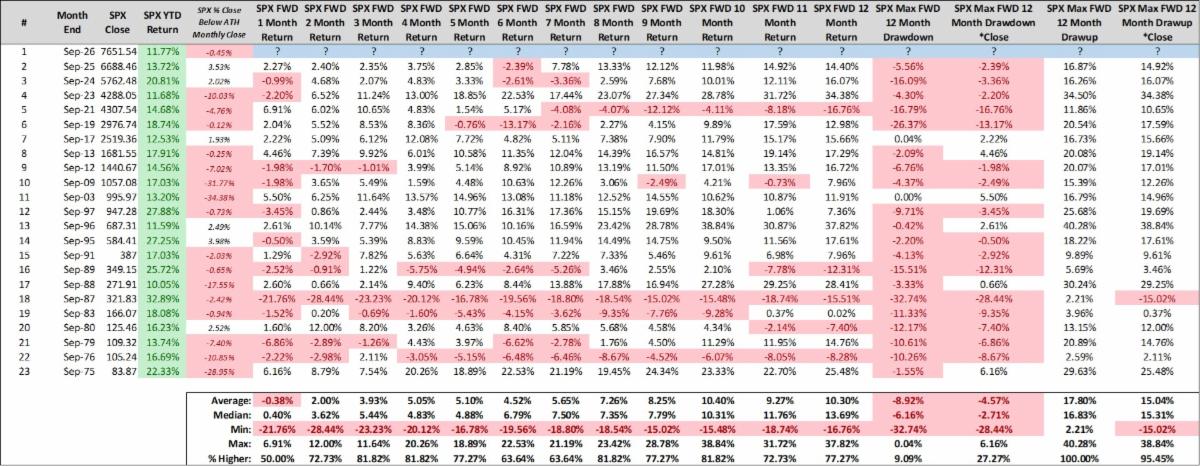
Looking ahead, the S&P 500's year-to-date return as of September's monthly close stood at 11.77%. When examining the index's forward performance following all calendar years that were higher by 10% or more through September's close, we can observe relatively strong forward three-month returns, meaning the fourth quarter or remainder of the calendar year.
Since 1970, there have been 22 prior calendar years that match. The S&P 500's forward three-month returns closed higher in 18 of those 22 instances, for average returns of roughly 4%. Of the four decliners, three were barely a scratch, with the index losing no more than -1.26%. The fourth was a knockout blow in 1987.
As always, the past can't be used to consistently predict the future.
The game is just not that easy. However, our confirmation bias certainly enjoys looking at a table that's predominantly white, and we'll take the historical tailwind wherever we can find it. Hopefully a strong fourth quarter is dead ahead.
Happy Sunday!
Steve & Rick
