The S&P 500 declined -0.37% this week with Friday's close at 4,395.26. The index traded as high as 4,429.97 on Thursday, a new all-time high, only to then find selling pressure on Friday to finish the week in the red. The index was mostly asleep all week, closing each trading day between 4,395.26 and 4,422.30. Not only did we hear from the Federal Reserve this week (click here), but we also saw a bevy of earnings from the largest of constituents within the S&P 500. Neither were able to spark any material volatility.
We'll call the price action this week a stalemate. On one hand, the S&P 500 managed to hang on to virtually all of the progress it made from last week's four-day price thrust, even with gigantic companies like Apple, Amazon, and Facebook all underperforming this week following their earnings releases.
On the other hand, we remain stuck at and around "resistance" at the ~4,400 marker. Last week's price action put us in position to break out, but this week's price action didn't actually break out. We do believe a decisive breakout toward the ~4,500 region is inevitable, it's just a matter of whether it happens in the coming 1-2 weeks, or 4-6 weeks. We're heading into a period that isn't exactly the most favorable in terms of seasonality.

The primary reason why the S&P 500 was able to shrug off poor performance from the likes of Amazon, Facebook and Apple this week was because of the "rotation" we saw. The "re-opening trade" jolted back to life this week, continuing the outperformance we saw last week during our four-day price thrust.
The materials sector was higher by 2.80% this week and has now increased nine trading days in a row. Energy was higher by 1.79%, and the financials gained 0.72%. Each of these areas outpaced the S&P 500 by 1% or more the last five trading days, and each of these sectors are considered the "epicenter" of the "reopening trade".

We have another week ahead filled with market-moving economic data. We'll get the ISM Manufacturing index on Monday, and Wednesday will bring the ISM Services index. Friday will bring us the jobs report, which always has the ability to operate as a catalyst for volatility.
Speaking of economic data, Charlie Bilello pointed out this week that Q2 real GDP set a new all-time high, recovering everything that was lost during peak pandemic (click here). Perhaps the reason the S&P 500 left a "V" on the chart is because the economy left a "V" on its chart.
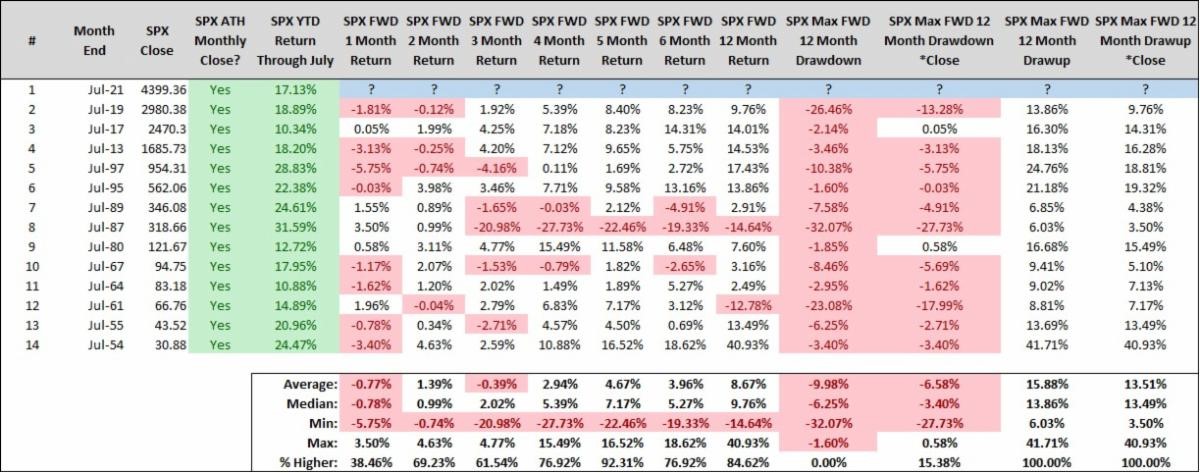
There are some ominous quantitative signs as we head into August (more on this below), so we'd like to see the month get off to a good start. We've set new all-time highs each and every month for nine months in a row now, and a trade up to ~4,430 this week would extend the streak to ten.
S&P 500 Primary Trend - Up
The S&P 500 finished the month of July on Friday, gaining 2.27% and closing at a fresh all-time high monthly close. The index has now increased six consecutive months, and all of them set a new all-time high monthly close. To say we've gone streaking is an understatement. The S&P 500 is on fire, like Steph Curry from deep in practice (click here).
After a streak like this, it's human nature to believe that "this can't continue". After all, prices don't move linearly forever. However, six-month winning streaks have actually been far more supportive of the idea that this can continue, rather than this can't continue.

However, while the forecast for the S&P 500's returns over the coming year look bright, the forecast for the index's returns in August looks a bit murky. For example, when the S&P 500 closes the month of July at a new all-time high monthly close, the index has generally struggled over the month of August.

What we also found interesting over the month of July was the fact that not only did the S&P 500 increase, but the Volatility Index (VIX) increased right alongside it. Coming into July, the VIX had moved opposite to the S&P 500 each and every month in 2021 (i.e., VIX was up in January and down every month since, the opposite of the S&P 500 which was down in January and up every month since).
Therefore, something was different in July. Participants, collectively, were not only eager to own equities in July, but they were also eager to transact in S&P 500 options. If we want to find a narrative, it's easy to believe that participants were eager to sell calls and buy puts on the S&P 500 under the idea that the forecast in August is murky. We'll know if that was the case come September 1st.
Quantitatively, when the S&P 500 finishes a calendar month at a new all-time high and the VIX finishes up for the same calendar month, and above the 15 level, the S&P 500 has closed the next month lower 6 times in a row and 8 of the last 9 overall. The average monthly decline each of the past 6 times is -2.64%, but over the last 9 times it strengthens to -1.75%. Regardless, there is some evidence to suggest that the VIX rise alongside the S&P 500 in July is a bit of an ominous sign for the month of August.
All that said, there is absolutely nothing wrong with the S&P 500 declining in the month of August (should it happen). Nobody would bat an eye if Steph Currey missed a three-pointer after making 103 in a row, and nobody should bat an eye if the S&P 500 takes a breather after the heater it's been on. Any decline in August is likely temporary and only an interruption of our "bull market", it will not end it.
It goes without saying, but he primary trend for the S&P 500 is up, which means long-term investors should strive to keep it simple and straightforward, and "be right and sit tight". It's worked for more than a year now and if it isn't broke...don't try to fix it. Just sit back and enjoy the ride, even if things get a bit bumpy in August.

Amazon Gets Whacked, Bitcoin Booms, Emerging Market Stocks Disappoint Again
Amazon.com, Inc. (AMZN) fell -7.56% on Friday and -9.00% this week. This is the worst week for AMZN since the final week of February 2020 when it declined -10.13% as broad equity markets began their Covid crash. AMZN's decline was attributed to its earnings beat, ironically (click here).

In last week's Update we wrote:
"Bitcoin is now trading back above $34,000, leaving us all to wonder...has Bitcoin finally bottomed?"
With Bitcoin now trading back above $40,000, we think the answer to our question was/is probably yes.
Bitcoin needs to hurdle and sustain above the $41.3k marker to break out of its recent trading range. If it does, we'll delete the word probably that we typed above.

Emerging market stocks (EM) have been huge laggards for years. Naturally, that fuels the "this can't continue" sentiment, especially for fundamental "value"-oriented investors. Valuations across EM are far more attractive than valuations in the United States.
Earlier in 2021 it appeared that EM was finding its footing relative to domestic equities. But after July, that's most definitely not the case - the S&P 500 outperformed EM by 8.53% in July.
The ratio chart of the S&P 500 relative to the MSCI Emerging Markets Free Index closed the month of July at a new all-time high. A massive "home country bias" remains your best bet, for now. It's as certain as death and taxes that this will change one day, but that one day isn't now.

Happy Sunday!
Steve & Rick