The S&P 500 declined -1.48% this week with Friday's close at 3,768.25.
The index traded quietly all week, floating its way up to 3,823.60 on Thursday and flirting with new all-time highs. But we then reversed lower into Thursday's close and declined an additional -0.72% on Friday to finish the week in negative territory. All in all, this week recorded as an "inside week", that is a calendar week with a lower high and a higher low than the prior trading week.

While the S&P 500 struggled this week, small-cap stocks did not.
The iShares Russell 2000 index (ticker symbol IWM) gained 1.46%, even with Friday's -1.49% decline. IWM has now increased 1% or more ten of the last eleven weeks (!) while gaining 38.09% over that time span. Participants have bought into the idea of an economic bonanza here in 2021, the likes of which small-cap stocks will be the primary beneficiary of. President-elect Biden revealed his stimulus plan this week (click here) and the general consensus is that it's expected to be small cap friendly.

From a sector perspective, the S&P 500 Equal Weight Index (SPXEW) outpaced the traditional market capitalization weighted S&P 500 (SPX) by 1.40% this week. This suggests smaller sectors outpaced larger sectors, a quick way to identify whether the dominant rotation trade we've seen since December is extending.
That was the case this week with the S&P 500 energy, utilities, and real estate sectors all gaining 1% or more this week. Technology (what we often call the Lebron James of the market) was one of the biggest losers this week, falling -2.62%. The bifurcation of COVID continues to manifest itself in somewhat of an all or nothing aspect to internal market behavior. Either technology does well and everything else lags, or everything else does well and technology lags. Given the uncertainty surrounding COVID in the back half of 2021, this is why we value a diversified "barbell" approach toward equity ownership at the moment.

As we look to the holiday-shortened week ahead, the key levels to watch next week are 3,826.69 and 3,662.71.
The former will see the S&P 500 remain resilient by shrugging off this week's decline and head back toward all-time highs. The latter will see this week's decline accelerate and leave us testing a confluence of support around the mid-3,600s, which has been meaningful support throughout December and January, and the ascending 50-day simple moving average at ~3,667.52. We think the odds slightly favor the market showing resilience and heading back toward all-time highs over the week ahead.
S&P 500 Primary Trend - Up
Our work continues to label the primary trend for the S&P 500 as up or "bullish".
During uptrends, long-term investors are generally best served with an equity overweight across their portfolios' asset allocation and relying mostly on passive investing methodologies.

There are a host of narratives about why the S&P 500 is doing so well, and one that seems to have persisted over the years is our good friend "TINA".
TINA is an acronym for the phrase "There Is No Alternative" and it speaks to the idea that investing in equities is the lone legitimate option for the investing community at the present moment.
With the federal funds target rate anchored to 0%, the Federal Reserve pursuing "inflate or die" policy actions and the yield on a 10-year United States Treasury bond closing Friday at 1.11%, the cash asset class pays next to nothing and the fixed income (bonds) asset class offers an incredibly high probability of negative real returns over time. While cash and fixed income can and do still play a role in portfolio construction (i.e., there is nothing that guarantees their forward returns to be worse than that of the equity markets) it's sensible that market participants would be far more eager to own stocks over bonds at the present moment. And an eager bid to own stocks tends to keep their primary trend as up or "bullish".
Take the dividend yield of the S&P 500 as an example, which closed Friday at 1.55%. That's 1.5x that of the yield on a 10-year United States Treasury bond! A long-term chart plotting the yield on a 10-year United States Treasury bond over the S&P 500's dividend yield (red and black line) reveals how distorted the relationship between stocks and bonds has become since the great financial crisis in 2008.

Thinking about the next 12 years, we all know that the Fed has pledged to keep interest rates low for the foreseeable future, and we know that the Fed has stated they want sustained higher inflation, and we know that the federal government is embracing elements of modern monetary theory (even if unknowingly) by spending a few trillion here and a few trillion there. So it's virtually impossible to believe a 10-year Treasury bond's 1.11% over the next decade is going to outpace the S&P 500's total return over the next decade. Think about it: which asset would you choose to own for the next decade, a 10-Year Treasury bond that will pay you 1.11% in nominal return or the S&P 500 where you can can potentially collect greater annual income and upside capture in the event stocks do rise? Seems like a no-brainer to us.
Now, it's fair to point out that the S&P 500 has produced negative nominal returns over a 10-year period before, and it's in that scenario where making 1.11% the next decade is relatively attractive. However, part of why we saw lost decades over the 2000-2009 and the 1973-1982 periods was because there was a 3x and 6x multiple of income investors could receive from buying a 10-year United States Treasury bond instead of collecting the dividends the S&P 500 was offering. It was easy for an investor to say "I'll sell my stocks and go make good money in Treasury bonds". Meanwhile, that ratio presently stands at 0.72, not even in the same continent as a 3x or 6x multiple, and the last thing most anyone wants to do is sell their stocks and buy Treasury bonds.

Putting it all together, TINA is alive and well at the moment. Her future is undoubtedly not as bright as her present, but the next time you feel like you should sell your stocks and duck for cover, ask yourself what are you going to invest the cash proceeds in? You'll find there simply isn't a good answer here yet, and that's partly why we believe stocks have more room to run to the upside over 2021 and beyond.
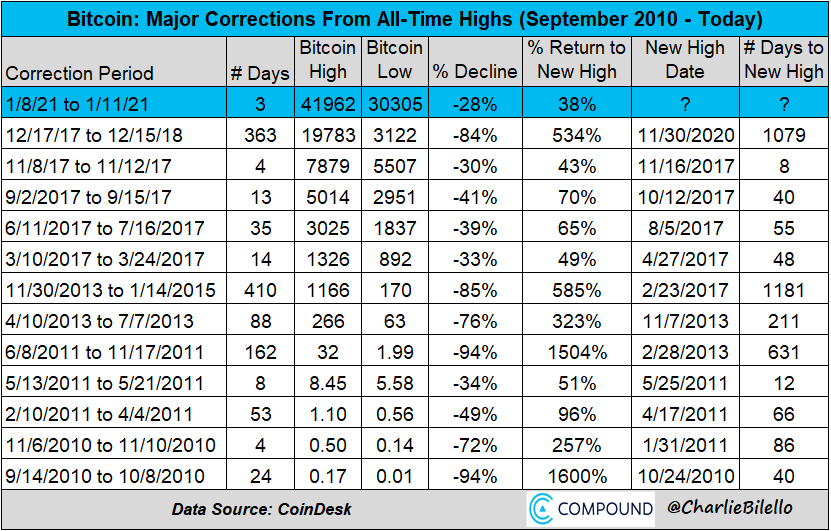
Bitcoin Corrects, Gold's At Support, Banks Look Ready
In last week's Update we noted how "overbought" Bitcoin (BTC) was and wrote "When the music stops here, the retracement is going to be spectacular to watch." It wasn't that spectacular, but BTC did fall nearly -30% in a matter of days.
It certainly feels like BTC has stolen a lot of gold's luster as "digital gold" has trounced the actual metal the last few months. Gold declined -0.30% this week and has now fallen two weeks in a row, and three of the last four. The metal is now a textbook picture of the idea that "old resistance becomes new support". Gold's weekly chart leaves the metal retesting its prior all-time highs. As we wrote last week, it's been a frustrating six months for gold. Perhaps that's a sign that the metal is actually going to catch a bid.

Finally, the S&P 500 Financials index (SPF) remains in position to break out here in January. Quite frankly, SPF's chart pattern is easy to fall in love with, and it resembles that of the iShares Russell 2000 index fund from a few months back. The financials have been a relatively terrible investment for a long time, but as they always say, past performance is not indicative of future results.

Happy Sunday!
Steve & RickThis material is being provided for client and prospective client informational purposes only. This commentary represents the current market views of the author, and Nerad + Deppe Wealth Management (NDWM, LLC) in general, and there is no guarantee that any forecasts made will come to pass. Due to various risks and uncertainties, actual events, results or performance may differ materially from those reflected or contemplated in any forward-looking statements. Neither the information nor the opinions expressed herein constitutes an offer or solicitation to buy or sell any specific security, or to make any investment decisions. The opinions are based on market conditions as of the date of publication and are subject to change. All data is sourced to stooq.com and stockcharts.com. No obligation is undertaken to update any information, data or material contained herein. Past performance is not indicative of future results. Any specific security or strategy is subject to a unique due diligence process, and not all diligence is executed in the same manner. All investments are subject to a degree of risk, and alternative investments and strategies are subject to a set of unique risks. No level of due diligence mitigates all risk, and does not eliminate market risk, failure, default, or fraud. It should not be assumed that any of the securities transactions or holdings discussed were or will prove to be profitable, or that the investment recommendations or decisions we make in the future will be profitable, or will equal the investment performance of the securities discussed herein. The commentary may utilize index returns, and you cannot invest directly into an index without incurring fees and expenses of investment in a security or other instrument. In addition, performance does not account other factors that would impact actual trading, including but not limited to account fees, custody, and advisory or management fees, as applicable. All of these fees and expenses would reduce the rate of return on investment. The content may include links to third party sites that are not affiliated with NDWM, LLC. While we believe the materials to be reliable, we have not independently verified the accuracy of the contents of the website, and therefore can't attest to the accuracy of any data, statements, or opinions.
