
The S&P 500 gained 3.58% this week with Friday's close at 7,757.64, a new all-time high weekly close, and that feels great to write!
The open of the week recorded as the low of the week, and the S&P 500 soared to a new all-time high of 7,798.68 on Wednesday. The index consolidated over Thursday and Friday's trade, another sign of strength, as the highest prices in the history of the S&P 500 didn't invite eager selling pressure into the marketplace. From a purely technical standpoint we're a pinch premature in saying this, but we believe the trading range that held the index captive for the last few months is now a thing of the past.
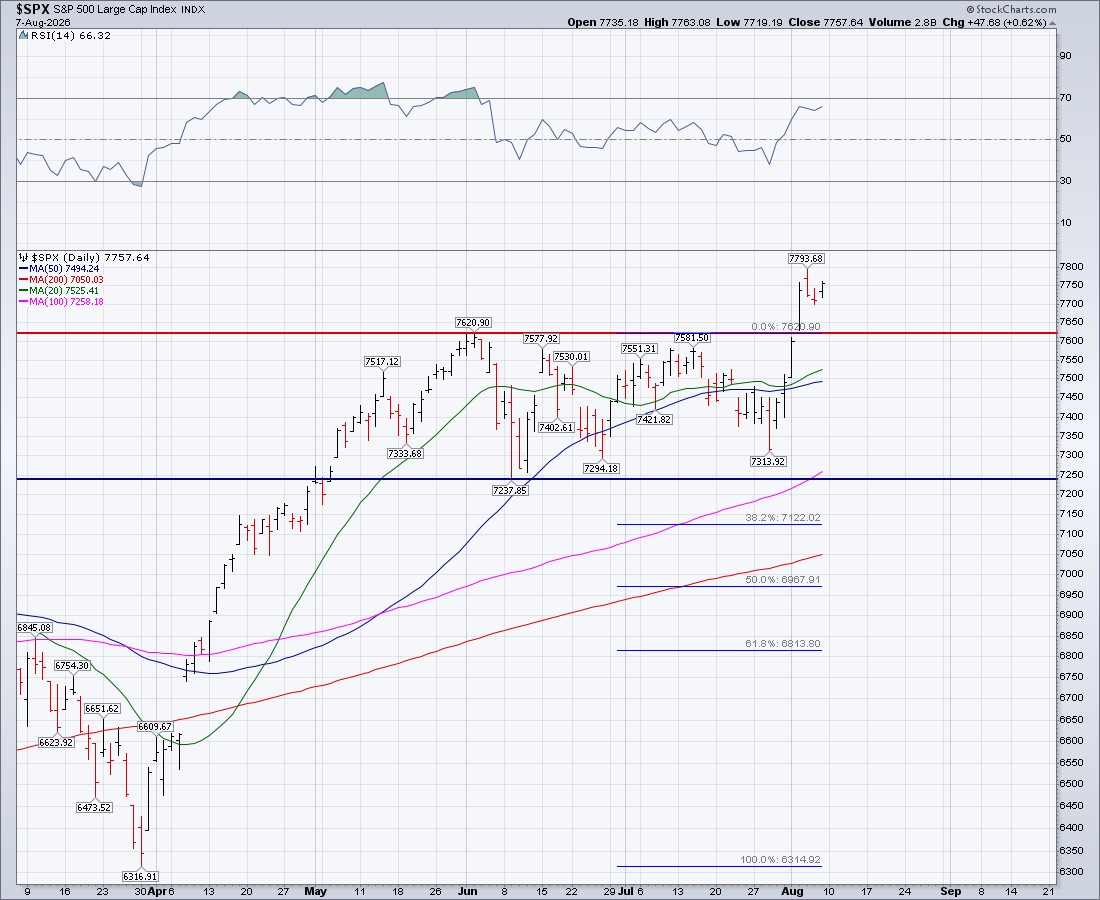
We can't say we saw the breakout coming this week, but we also won't say we're surprised to see the S&P 500 break out to new all-time highs. In last week's Update we wrote:
"But as we have written in past Updates, the longer a trading range holds, the more meaningful the eventual breakout tends to be. Given that the range is following a massive sprint higher for the index, we continue to believe the breakout will be to the upside."
And from our Update dated 07/19/2026 we wrote:
"It goes without saying that anything is always possible in the world of markets, but we believe this trading range will ultimately be remembered as a continuation pattern. The primary trend for the S&P 500 is up. Trading ranges that form during primary uptrends most commonly resolve to the upside. We see no reason to believe this one will be any different as of now."
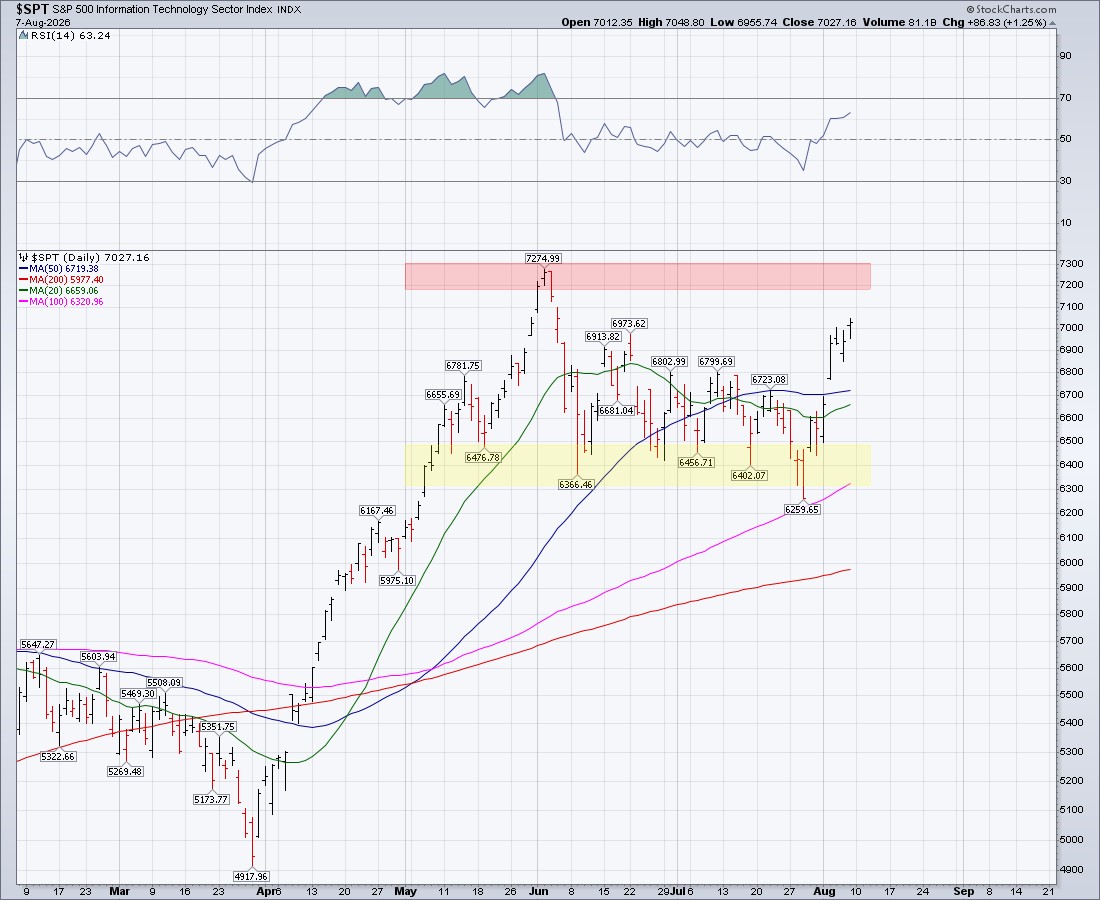
The breakout this week was brought to us by the S&P 500's biggest and best player rediscovering its mojo, the S&P 500 Information Technology sector (SPT) absolutely ripping to the upside. SPT gained a whopping 7.22% this week. We noted encouraging developments for SPT in our Update from 07/26/2026, writing:
"The S&P 500 Information Technology sector (SPT) actually gained ground this week, rising 0.43%. SPT remains rangebound as well, but the index is trading near the lower end of its range and has recently found support at and around the lows from May and June -- an encouraging sign that buyers are stepping in right at support. Much of this week's strength within SPT is attributable to Apple, which gained 3.53% on Friday and is now knocking on the door of new all-time highs (chart below). The stabilization of SPT is a constructive development and one we will continue to monitor closely in the weeks ahead."
Referencing the chart of SPT below, support has held, but SPT has not yet hurdled resistance and broken out to a new all-time high. However, if that is what's in the on-deck circle, and we think it is, the S&P 500 will climb into the 8,000s here in August.
Eight of the 11 sectors within the S&P 500 closed higher this week, with five of them gaining more than 2%.
Interestingly, only three sectors finished the week at a new all-time high weekly close: industrials, health care and financials. Speaking of financials, the S&P 500 Financials Sector Index (SPF) has now increased a ridiculous 10 weeks in a row. We have weekly closing price data for SPF dating back to 1997, and this is the first 10-week winning streak in the index's history. Say it with us now...markets trade beyond the limits of imagination.
Even with the S&P 500's advance this week being extremely top-heavy, the S&P 500 Equal Weight Index (SPXEW) still gained 2.40% on the week.
The ProShares S&P 500 Ex-Technology ETF (SPXT) gained 1.33%, which is a great sign -- the role players didn't go cold when the index's best player finally broke out of its slump. When the star and the supporting cast are both contributing, good things tend to follow. Small-cap stocks partied too, the S&P 600 Small-Cap Index (SML) gained 2.41% this week and finished at a new all-time high weekly close.
Fundamentally, the big driver this week was what we discussed in last week's Update - the massive "T.A.C.O." trade (click here). Crude oil plunged -8.98% this week with Friday's close at $77.07. We also got a relatively weak jobs report on Friday (click here), which was a textbook case of bad news being good news. Lower crude oil prices operate like a tax cut for the consumer and alleviate forward-looking inflationary fears. A softening labor market, meanwhile, suggests that forward-looking monetary policy won't need to be as tight as previously feared. Together, these are powerful equity-friendly developments, and they shaped the narrative behind why the S&P 500 finally broke out to new all-time highs this week.
A few other areas of note this week:
- Gold absolutely roared to the upside this week, gaining 7.36% with Friday's close at $4,340.72. There is still a long way to go before gold can resume a primary uptrend - it would need to trade back above the $5,000 level to set new all-time highs, but the price thrust this week is an encouraging sign that the climb back toward that level has begun.
- The Philadelphia Semiconductor Index (SOX) roared back to life as well, ripping higher by 9.25%. SOX and gold find themselves in identical situations: a long hill to climb before reaching new all-time highs, but both appear to have taken their first meaningful steps uphill this week. Nvidia exploded 11.56%...
- International stocks continue to impress, with developed markets in Europe being the standout. The iShares MSCI EAFE ETF (EFA) gained 2.81% this week with Friday's close at $108.55, building on last week's 2.10% advance which also closed at a new all-time high weekly close. There is no trading range for EFA, just more new highs, week after week.
As for the week ahead, we have one wish for the S&P 500 - close every trading day above the 7,700 level.
S&P 500 Primary Trend - Up
With the S&P 500 trading at new all-time highs, our work continues to label the primary trend as up, or "bullish."
Generally speaking, long-term investors are best served striving to "be right and sit tight" with their portfolio during primary uptrends. Being right and sitting tight is best described as implementing your portfolio's target asset allocation and relying primarily on passive investing methodologies. This approach has been on an absolute tear the last few years, and if the last five days are any guide, there is more to come.
The price of the S&P 500 is autocorrelated in a way that supports the idea that "strength begets strength."
This means that market participants, collectively, should only exhibit eager buying interest in the present if they expect higher prices in the future. Think about it...why would anyone buy stocks today if they didn't expect them to be worth more tomorrow? In light of the price thrust we've witnessed over the last five days, it is entirely reasonable to believe the path of least resistance remains to the upside for the remainder of 2026, even if we cool down at some point before the fourth quarter arrives.
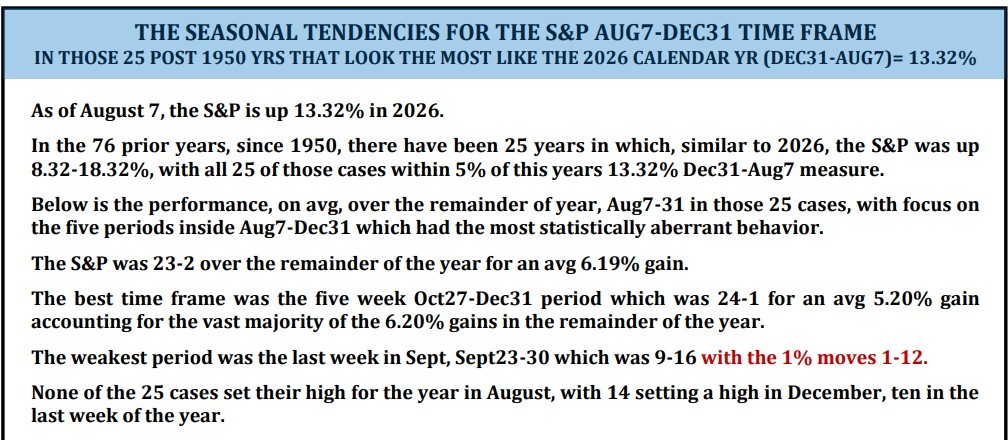
The great Wayne Whaley shared an interesting study this week that further supports the notion of "strength begets strength." Wayne identified all calendar years where the S&P 500 was higher by between 8.32% and 18.32% on a year-to-date basis through August 7's close, and there were 25 in total. The S&P 500's return over the remainder of those calendar years closed higher 23 of 25 times, for average returns of 6.19%. Applied to Friday's close, that would target a year-end closing price for the S&P 500 near ~8,237. We'll certainly take it.
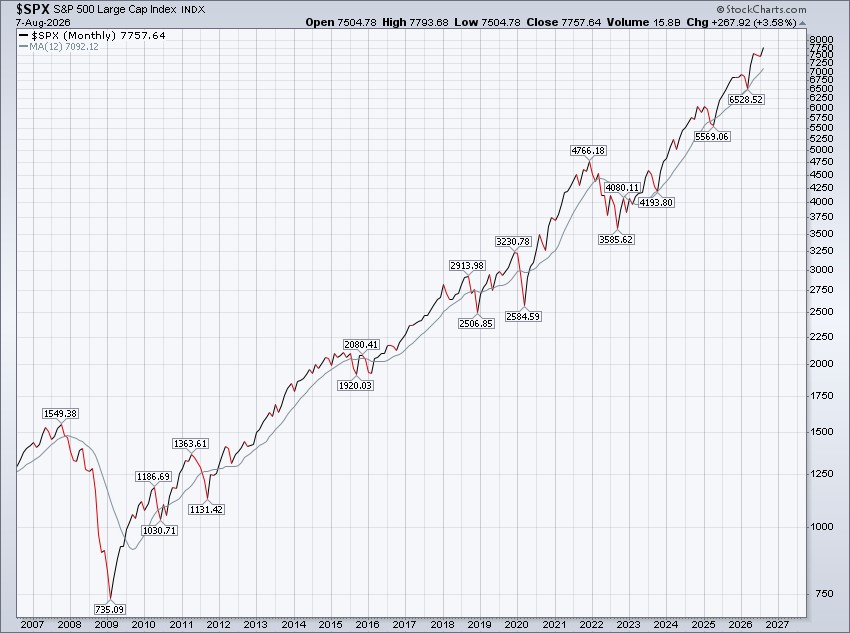
Finally, while the tone of this Update is decidedly "bullish" and we would bet on higher prices into the future, we won't pretend to truly know what lies ahead for the S&P 500 -- regardless of this week's breakout.
The S&P 500 will do whatever it wants, however it wants, and will trade beyond the limits of what any of us can imagine. There is truly no telling just how high, or how low, the index can trade over the coming six months. For this reason, we continue to preach prudent risk management and disciplined adherence to the rules of your investment strategy. Because, as they teach us in kindergarten, when you follow the rules you stay out of trouble.
Happy Sunday!
