The S&P 500 gained 3.36% this week, with Thursday's close at 6,582.69.
The index’s five-week losing streak is now a thing of the past, the bulls have at least gotten back to their feet, and we now have both a top and a bottom on the chart to work with.
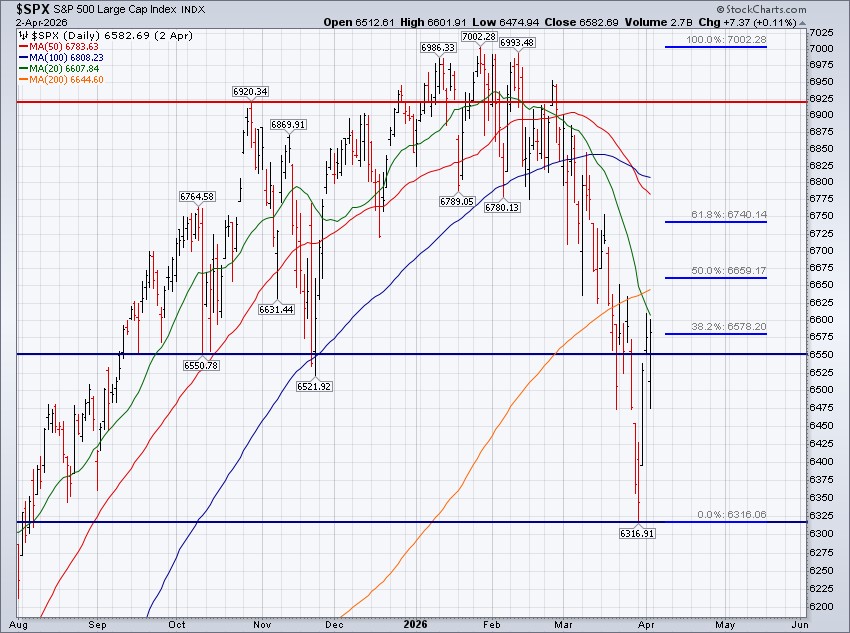
The S&P 500 traded down to 6,316.91 at Monday's low, and it was off to the races from there as participants finally stepped up and bought the dip.
By Thursday's high of 6,609.67, the S&P 500 had added 4.63% in two short trading days and we all let out a sigh of relief. Whether this bounce was driven by fresh demand entering the market or short sellers covering their positions is largely irrelevant in our view, as both tend to occur when near-term sentiment shifts toward conviction in higher prices.
But this is where the price action actually differed this time. The S&P 500 fought back, market participants bought the dip, again, and Thursday saw the index turn what was a daily decline of -1.53% at the low into a gain of 0.11% by the close at 6,582.69. Encouraging developments, at the very least.
Now, some perspective around this week's bounce: it did little to improve the technical picture for the S&P 500, which remains a mess. In last week's Update, we wrote:
"There will be a bounce, there always is, but the more important question is whether that bounce will establish a lasting bottom on the chart. At this point, that remains highly uncertain."
Technicians across Wall Street now have a thick horizontal line drawn at 6,316.91 and there is hope that it marks a lasting bottom and the end of this correction, but that still remains highly uncertain. The S&P 500 remains below all widely followed moving averages, most of which are now negatively sloping, and has yet to reach even the 50% Fibonacci retracement level, which sits at 6,659.17.
The war with Iran continues to dominate the narrative and drive near-term price action.
Much of this week's advance in the S&P 500 was attributed to Tuesday's 2.92% gain, which was at least partially influenced by the perception that the conflict could end sooner rather than later. However, the rhetoric over the weekend doesn’t exactly sound "peaceful" (click here).
Crude oil certainly didn’t take a break this week, it surged 11.94%. That’s a meaningful divergence and throws a few drops of cold water on the durability of this week's bounce. The crude oil futures curve suggests the jump in oil prices is expected to be "transitory" (click here), but the Fed's not exactly on board (click here).
It was also a strong week for diversification as bonds and precious metals moved higher alongside equities. The iShares Core U.S. Aggregate Bond Index Fund (AGG) gained 1.04%, while the yield on the 10-year U.S. Treasury (UST10Y) declined by 13 basis points to finish the week at 4.31%. We continue to believe bonds are quite attractive at current prices and interest rates, though this view depends on whether the impending uptick in inflation proves to be transitory.
Gold added 4.05% this week, and silver gained 4.93%. Aggregate commodities, as measured by the Invesco DB Commodity Index Fund (DBC, click here), gained 0.79% this week and DBC has now increased seven weeks in a row.
As for the week ahead, the market was closed last Friday, but we did receive a strong jobs report (click here). There is a significant amount of market-moving economic data coming this week and we’ll get inflation reports on Thursday and Friday, so it will be interesting to see how the market trades throughout the week and into those releases.
The levels we’re watching in the coming week are 6,609.67 on the upside and 6,316.91 on the downside.
S&P 500 Primary Trend - Up, But...
The S&P 500 closed March on Tuesday. Month-end magic saw the S&P 500 gain 2.92% on Tuesday, the final trading day of March, to clean things up nicely into month end. The index still lost -5.09% for the month, but strength on Tuesday left an otherwise nasty month ending on a positive note.
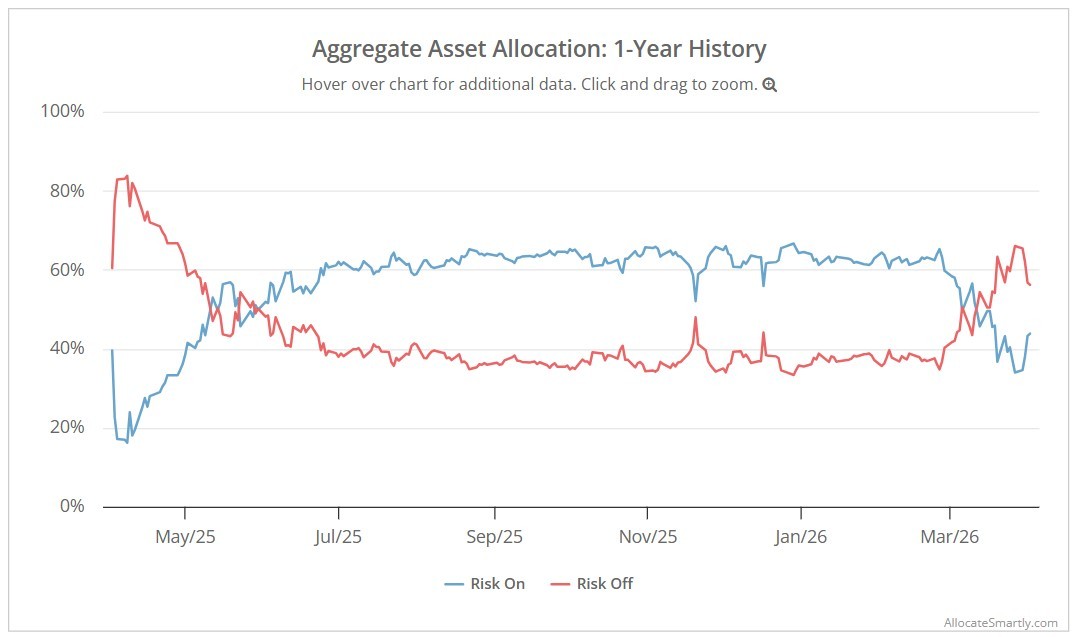
March's monthly close managed to sustain above the 12-month simple moving average, but many other popular tactical asset allocation models did move to risk-off.
While our work continues to label the primary trend for the S&P 500 as up, or "bullish", it's doing so by the slimmest of margins.
The price action throughout April will be pivotal in shaping what lies ahead. If the market ultimately resolves higher from here in April, maintaining exposure according to your plan ensures continued participation. If instead the price action develops into something more akin to 2022, having a predefined framework for reducing risk can help limit the damage. Both outcomes are possible and neither outcome can be forecast with any consistency.
As we’ve written many times before, the goal is not to predict what the S&P 500 will do next. That's impossible to do consistently and a flawed long-term process. Instead, the goal is always to ensure that your portfolio is positioned appropriately given what the S&P 500 has already done. It's like they say: "Follow the money."
Importantly, it's in market climates like this when discipline matters most.
Not when markets are roaring higher and confidence is abundant, but when conviction is hardest to come by, when the climate can be described as radically uncertain. Markets like this have a way of baiting investors into overreacting and driving emotional decision- making, and investors allow the fear of striking out to keep them from playing the game. This is exactly the type of behavior a rules-based approach is designed to eliminate.
For now, our work suggests we remain in a potential transitional phase. We're not yet in a confirmed downtrend, but we're also no longer in a clear, easy-money uptrend investors enjoyed in prior years. Until that changes, a balanced, rules-driven approach continues to make the most sense to us.
Happy Sunday!
Steve & Rick