The S&P 500 gained 0.34% this week with Friday's close at 6,939.03. We ended last week's Update writing:
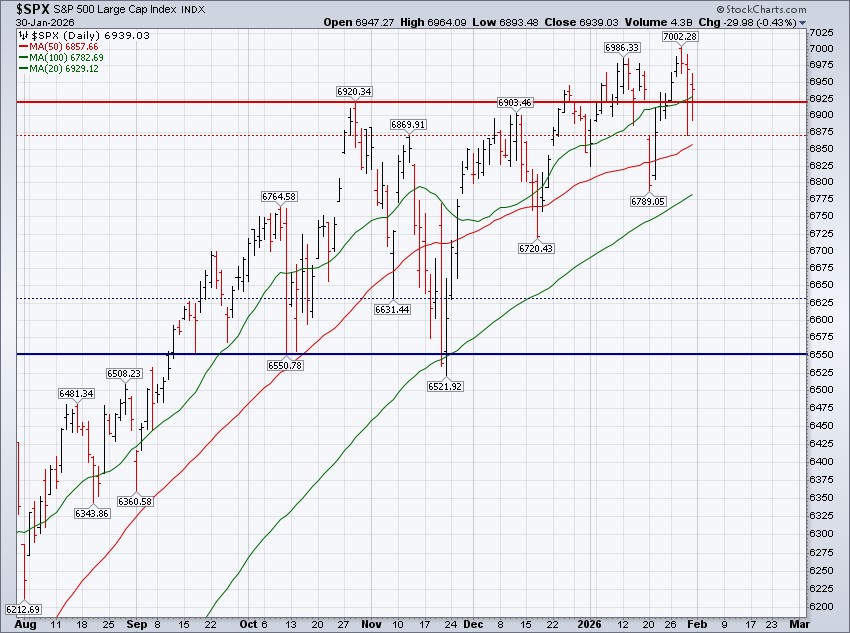
"Key technical levels to watch coming into the week are 6,934.75 on the upside and 6,789.05 on the downside. Any trade above the former will set the stage for some month-end magic to ideally climb toward the 7,000 level by Friday."
The S&P 500 traded up to 7,002.28 on Wednesday, a new all-time high, and appeared poised to break out to the upside. Strength through Thursday and Friday was all that was needed to solidify an extension above resistance and fuel optimism that the S&P 500’s uptrend had resumed.
However, the index tripped and stumbled during Thursday and Friday’s trading, swinging the narrative. The price action this week did little to resolve the broader stalemate that has defined trading over the past three months. Despite Wednesday’s new all-time high, the index ultimately finished the week trapped within its well-established trading range, continuing to frustrate short-term traders while testing the patience of longer-term investors.
Referencing the chart below, the S&P 500 remains range-bound, and the message from the price action is clear - keep your "patient hats" on for a bit longer.
Fundamentally, the Fed was quiet this week, leaving interest rates unchanged. Trump's preferred Fed chair was revealed. Inflation data ticked higher and consumers are not exactly confident. The picture isn't perfect, but the probability of recession in 2026 remains low.
Regarding market internals, little changed for the S&P 500 this week on the surface level. However, as has increasingly been the case, the more important developments continue to take place beneath the surface of the S&P 500.
Domestically, market internals were a mixed bag. As we wrote last week, participation continues to broaden beyond a narrow group of mega-cap leaders. Seven of 11 sectors within the S&P 500 outpaced the return of the S&P 500 itself. However, most of these areas were the defensive sectors of the market this week. For example, energy stocks continued to lead the way, ripping higher by more than 3% this week. The energy sector is now higher by a whopping 14.37% so far in 2026. Consumer staples gained 0.72% this week and have now increased four weeks in a row and finished at a new all-time high weekly close. Communication services and utilities each gained more than 1% on the week too. The former was catapulted higher by Meta, which surged 8.76% this week.
While MAGS gained 0.81% this week, the performance across its holdings was as bifurcated as we've ever seen. Two components got clobbered: Microsoft fell -7.65%, Tesla fell -4.15%, while Meta, Alphabet and Apple all gained more than 3% this week. The old phrase "it's a stock picker's market" comes to mind, and it's been entirely pertinent thus far to start 2026.
Some other areas of note this week across the equity asset class:
- International stocks lead. The iShares MSCI All Country World Index (ACWX) Ex-US gained 0.30% this week.
- Small-cap stocks struggled. The S&P 600 Index (SML) fell -0.91% and the iShares Russell 2000 Index fell -1.95%.
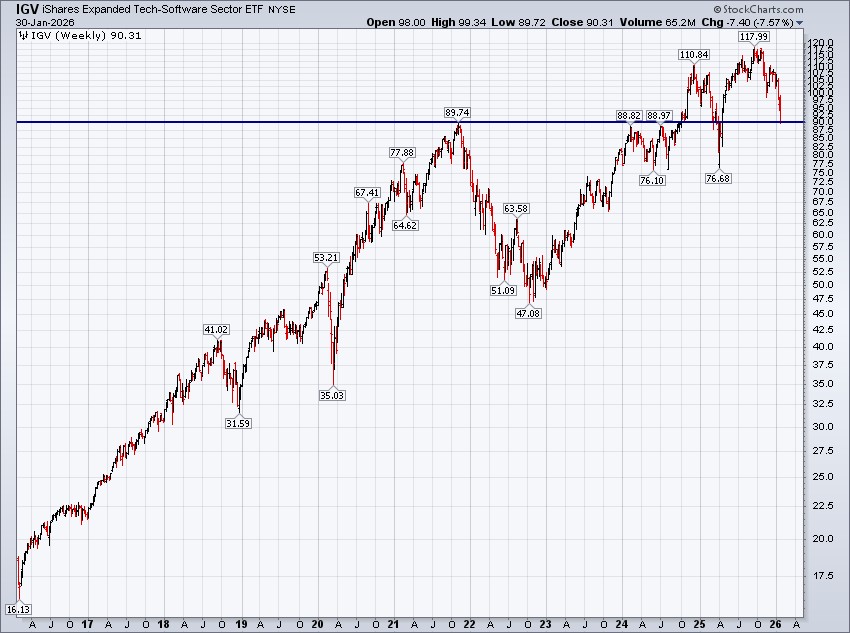
- Software gets clobbered...there's blood in the streets in the software space.The iShares Expanded Tech-Software Sector ETF (IGV) fell -7.57%. We're not the type to catch a falling knife, but IGV's going on five years of absolutely nothing at current levels (see the chart below) and that suggests there are opportunities within the space.
Bond prices were little changed this week, leaving interest rates across the yield curve little changed this week too.
Given the context of rising PPI, and growing concerns regarding an upside acceleration in the Consumer Price Index (CPI) given rising energy prices, it's actually a welcomed sign that bond prices held steady this week. The yield on a 10-year Treasury bond did nothing this week, even with crude oil jumping 7.65% this week alongside PPI data.
Precious metals traded like meme stocks this week.
Gold fell -2.02% this week, but the metal traded up to $5,608.35 at the high of the week and finished the week back down at $4,886.71. That's a decline of -12.87%. Silver fell a massive -17.79% this week and traded down more than -30% from a weekly high at $121.64 to a weekly close at $84.63. Price action like this does little to support confidence in the integrity of financial markets.
S&P 500 Primary Trend - Up
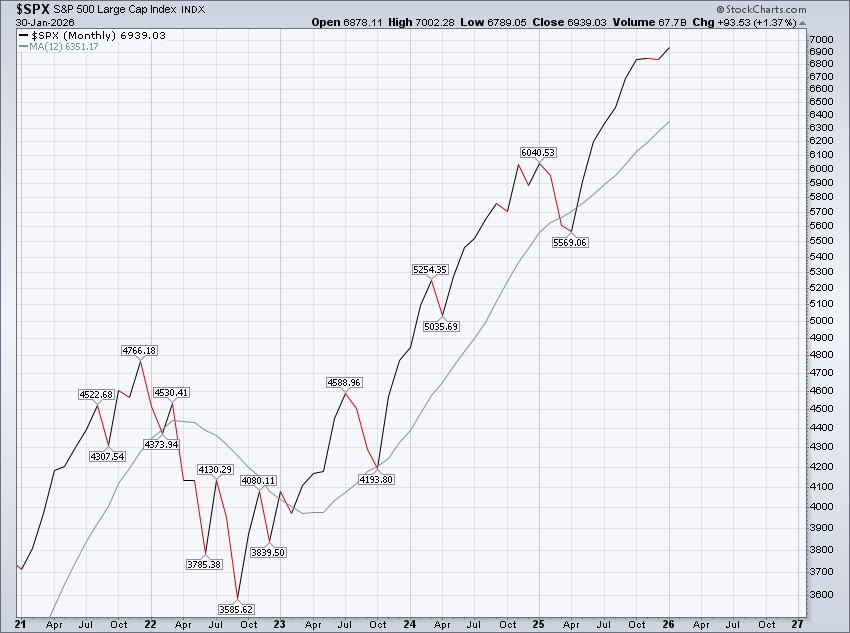
The S&P 500 finished the month of January on Friday, gaining 1.37% for the month. January's monthly close is a new all-time high monthly close.
From our Update dated 01/04/2026 we noted that after a seven-month winning streak for the S&P 500 comes to an end (as we saw in the month of December), we "...do find it interesting that, in every prior case, the S&P 500 simply dusted itself off and returned to its winning ways." Naturally, the S&P 500 got back to its winning ways in January.
While the index is stuck in neutral on the daily chart, it's comfortably in drive on the monthly chart. There's not even a hint of resistance on the chart below.
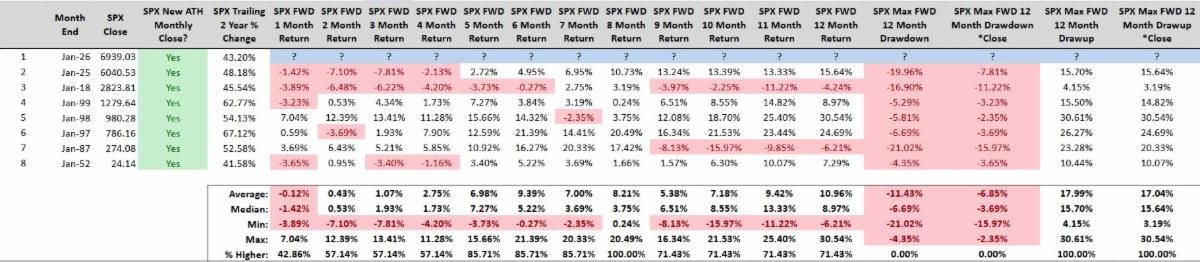
Quantifying January’s price action reveals some interesting data. January finished with a new all-time high monthly close and trailing two-year returns exceeding 40%. Since 1950, there have been only seven other Januarys that meet this criteria.
What’s interesting is that in each of the last two instances where we’ve seen a rolling two-year period like this, the S&P 500 traded poorly over the subsequent quarter. However, it’s also worth noting that the S&P 500 has never closed lower eight months later after finishing January under these same conditions.
Looking ahead, we continue to believe long-term investors are best served by investing in the more traditional sense of the word.
The recipe for success during primary uptrends is generally an equity overweight within a portfolio’s asset allocation and a reliance on mostly passive investing methodologies. It isn’t until the primary trend can be labeled as down, or “bearish,” that long-term investors should consider prioritizing capital preservation over capital appreciation.
That said, the month of January revealed that what long-term investors should be investing in is no longer as cut-and-dry as simply owning broad-based market indices. All stocks were not created equal in January, and there is material evidence to suggest that long-term investors can benefit from diversifying their equity ownership —something that hasn’t been equitable or necessary for a long, long time.
Consider the following performance metrics from January:
- The S&P 600 Small Cap Index gained 5.55%
- The iShares MSCI USA Value Factor Index gained 7.64%
- The S&P 500 Equal Weight Index gained 3.28%
- The iShares MSCI Emerging Markets Index gained 8.04%
And the list could go on.
Like most things in life, timing matters.
If January’s price action is any indication (still a big "if"!), it may be time for long-term investors to diversify their equity holdings, aligning their portfolios with a market that appears to be transitioning from leadership by a small, narrow group of mega-cap stocks to a broader and more diverse collection of leaders across sizes and styles.
Happy Sunday!
